Typo, add URL.
Source Link
agc
  • 13k
  • 4
  • 38
  • 73

One alternative is to let a totally impartial computer decide, based purely on census data and geography, with no details about the political (or other) makeup of the population. Brian Olsen's open source census-based B-districting algorithm aims for:

Across all districts and all people, The best district map is the one where people have the lowest average distance to the center of their district.

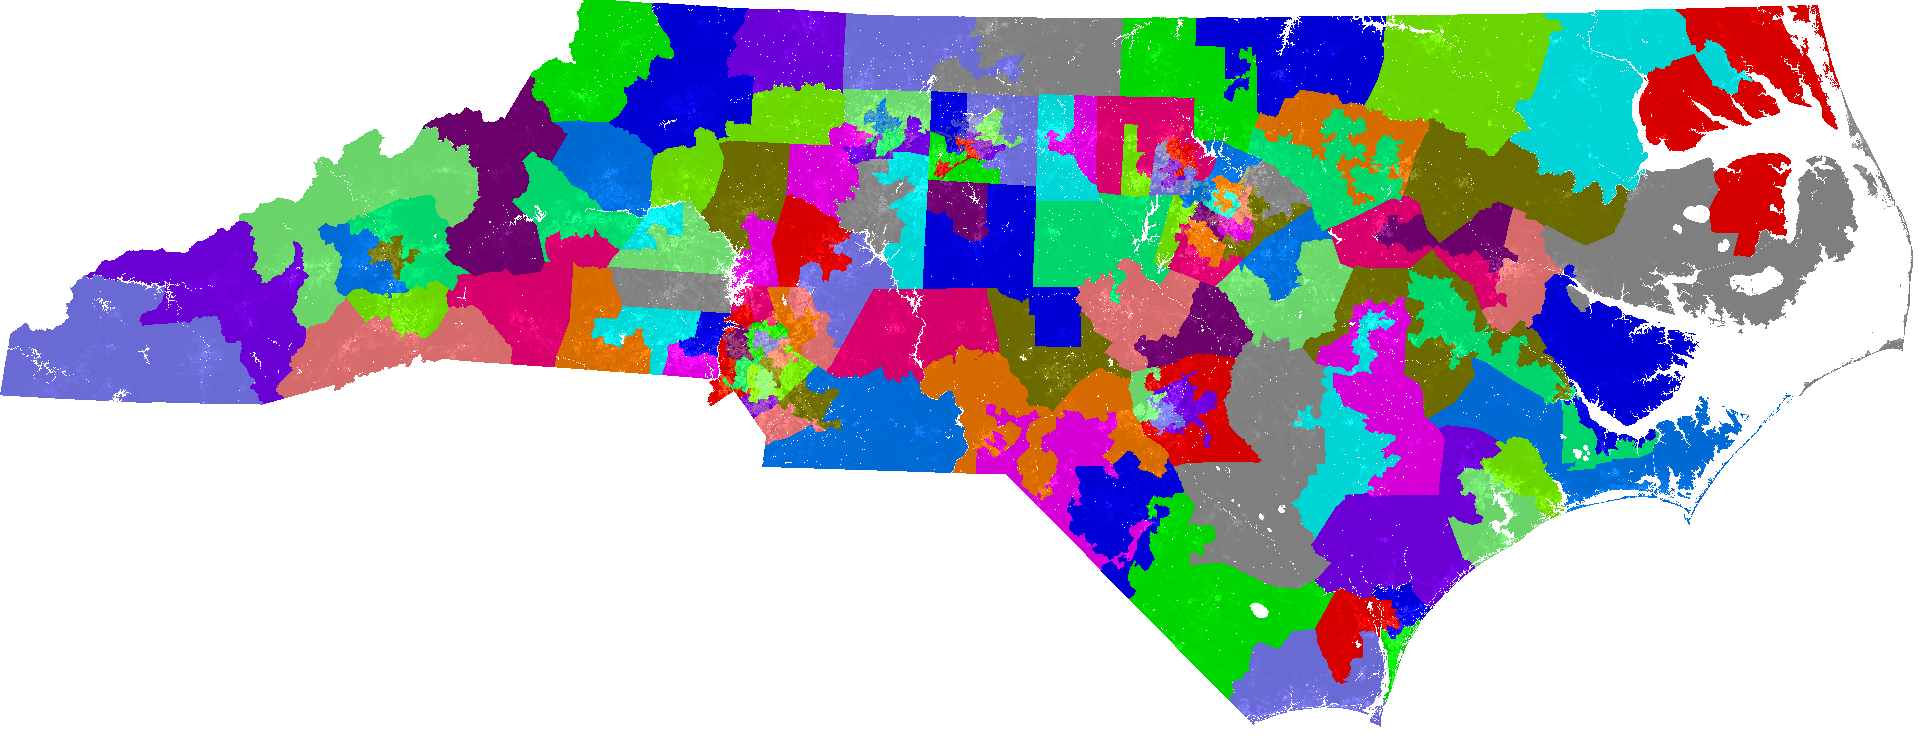
Comparative pictures, using North Carolina's House of Representatives districting. North Carolina using current method:

Picture of NC's jaggy rambling districts.

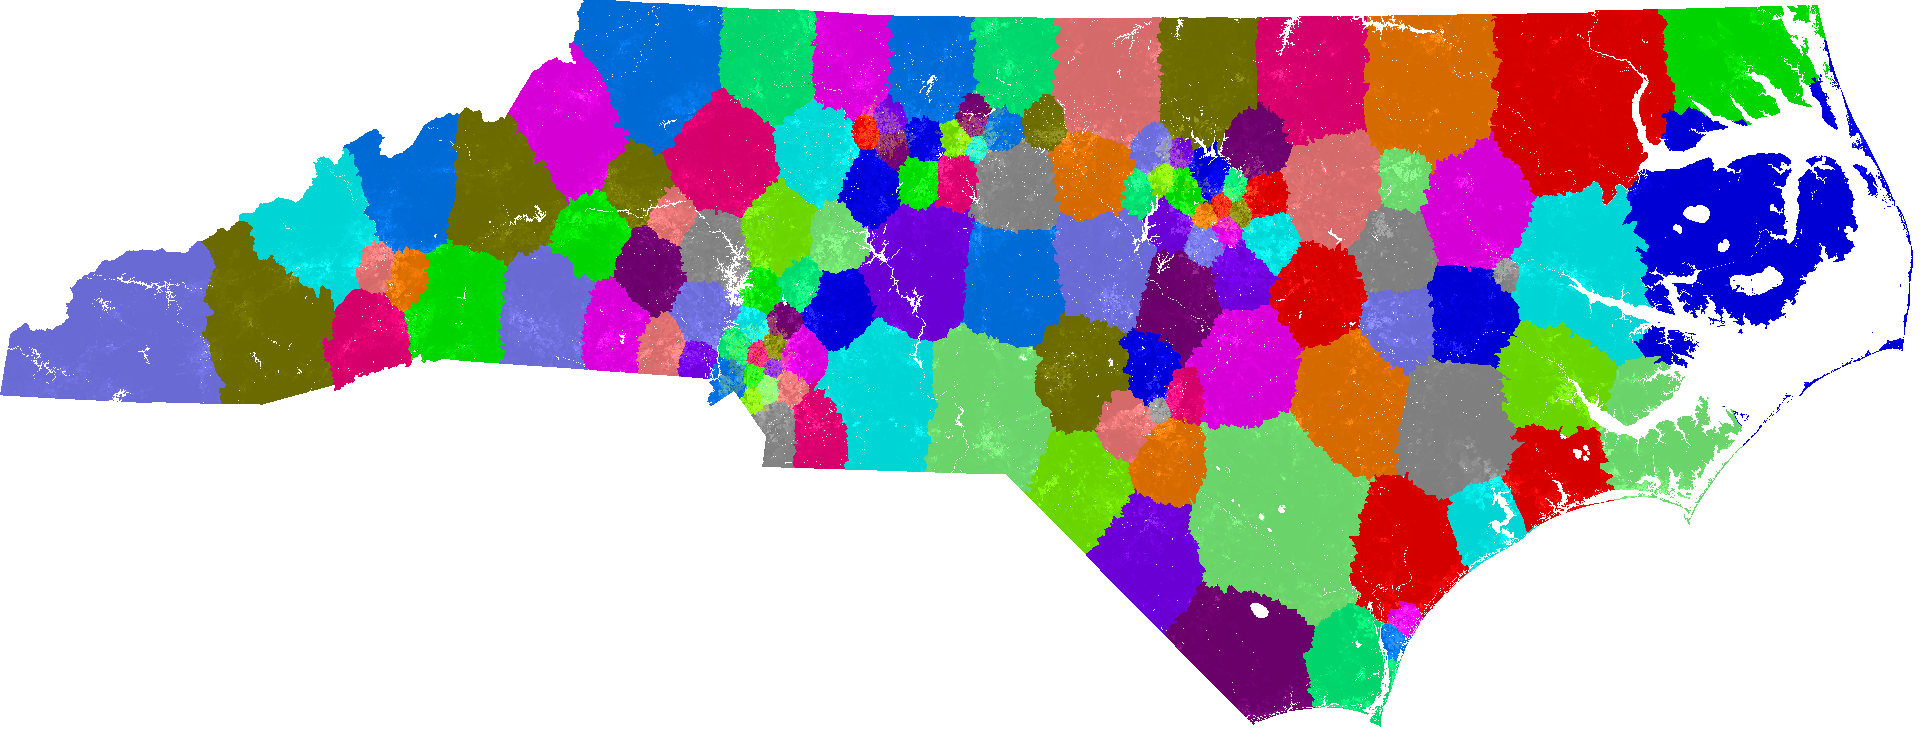
B-districting, based on 2010 census:

B-district NC picture, resembles patio stones.


(As a satirical gesture in lieu of posting to metaa satirical gesture in lieu of posting to meta Brythan felt inspired to add the following interesting critique of B-districting. Unfortunately the critique relies on a usage of the term "community""community" that seems practically synonymous with current two-party districting, and includes an alphabetic diagram that I'm so far unable to decipher. -- agc)

Of course, this geometric compactness breaks geographic compactness, where neighbors who share a community are put in the same district. And of course they aren't necessarily fair. Geometric compactness does not protect minority representation. This shifts the battle from drawing the districts to picking the algorithm. Consider the following figure:

AAbbb  AAaaa
AAbbb  AAaaa
AAbbb  BBbbb
AAccb  BBbbb
AAccc  CCccc
DDccc  CCccc
DDcce  DDddd
DDeee  DDddd
DDeee  EEeee
DDeee  EEeee

Capital letters are Republican districts and lowercase letters are Democratic districts. Same map with two different districting plans. The five districts each have a letter.

If we define fair as a proportional result here, which is fairer? The proportion is two Republicans to three Democrats. The first is 3 to 2 Republican to Democrat. The second is 0 Republicans to 5 Democrats. The first is closer to the ideal ratio, but the second looks better to the eye.

We don't see this in the state map, as most of us don't know the geographic regions of North Carolina. So it isn't evident to us when most of these relations are broken. This creates a superficial appearance of fairness while actually creating an unfair result. Unfair to whom? Primarily the communities that get split without any recourse short of changing to a different algorithm.

Contrast this with a proportional method like Single Transferable Vote. There the voters get to choose how they group. Is ideology most important? Voters can pick ideologically similar representatives. Is local representation important? Then voters can pick representatives who live close to them (and define for themselves what close means). Minority voters can choose people with similar backgrounds. And voters can suggest how they'd like to compromise if their first choice doesn't make it.
One alternative is to let a totally impartial computer decide, based purely on census data and geography, with no details about the political (or other) makeup of the population. Brian Olsen's open source census-based B-districting algorithm aims for:

Across all districts and all people, The best district map is the one where people have the lowest average distance to the center of their district.

Comparative pictures, using North Carolina's House of Representatives districting. North Carolina using current method:

Picture of NC's jaggy rambling districts.

B-districting, based on 2010 census:

B-district NC picture, resembles patio stones.


(As a satirical gesture in lieu of posting to meta Brythan felt inspired to add the following interesting critique of B-districting. Unfortunately the critique relies on a usage of the term "community" that seems practically synonymous with current two-party districting, and includes an alphabetic diagram that I'm so far unable to decipher. -- agc)

Of course, this geometric compactness breaks geographic compactness, where neighbors who share a community are put in the same district. And of course they aren't necessarily fair. Geometric compactness does not protect minority representation. This shifts the battle from drawing the districts to picking the algorithm. Consider the following figure:

AAbbb  AAaaa
AAbbb  AAaaa
AAbbb  BBbbb
AAccb  BBbbb
AAccc  CCccc
DDccc  CCccc
DDcce  DDddd
DDeee  DDddd
DDeee  EEeee
DDeee  EEeee

Capital letters are Republican districts and lowercase letters are Democratic districts. Same map with two different districting plans. The five districts each have a letter.

If we define fair as a proportional result here, which is fairer? The proportion is two Republicans to three Democrats. The first is 3 to 2 Republican to Democrat. The second is 0 Republicans to 5 Democrats. The first is closer to the ideal ratio, but the second looks better to the eye.

We don't see this in the state map, as most of us don't know the geographic regions of North Carolina. So it isn't evident to us when most of these relations are broken. This creates a superficial appearance of fairness while actually creating an unfair result. Unfair to whom? Primarily the communities that get split without any recourse short of changing to a different algorithm.

Contrast this with a proportional method like Single Transferable Vote. There the voters get to choose how they group. Is ideology most important? Voters can pick ideologically similar representatives. Is local representation important? Then voters can pick representatives who live close to them (and define for themselves what close means). Minority voters can choose people with similar backgrounds. And voters can suggest how they'd like to compromise if their first choice doesn't make it.

Contributor note.
Source Link
agc
  • 13k
  • 4
  • 38
  • 73

One alternative is to let a totally impartial computer decide, based purely on census data and geography, with no details about the political (or other) makeup of the population. Brian Olsen's open source census-based B-districting algorithm aims for:

Across all districts and all people, The best district map is the one where people have the lowest average distance to the center of their district.

Comparative pictures, using North Carolina's House of Representatives districting. North Carolina using current method:

Picture of NC's jaggy rambling districts.

B-districting, based on 2010 census:

B-district NC picture, resembles patio stones.


(As a satirical gesture in lieu of posting to meta Brythan felt inspired to add the following interesting critique of B-districting. Unfortunately the critique relies on a usage of the term "community" that seems practically synonymous with current two-party districting, and includes an alphabetic diagram that I'm so far unable to decipher. -- agc)

Of course, this geometric compactness breaks geographic compactness, where neighbors who share a community are put in the same district. And of course they aren't necessarily fair. Geometric compactness does not protect minority representation. This shifts the battle from drawing the districts to picking the algorithm. Consider the following figure:

AAbbb  AAaaa
AAbbb  AAaaa
AAbbb  BBbbb
AAccb  BBbbb
AAccc  CCccc
DDccc  CCccc
DDcce  DDddd
DDeee  DDddd
DDeee  EEeee
DDeee  EEeee

Capital letters are Republican districts and lowercase letters are Democratic districts. Same map with two different districting plans. The five districts each have a letter.

If we define fair as a proportional result here, which is fairer? The proportion is two Republicans to three Democrats. The first is 3 to 2 Republican to Democrat. The second is 0 Republicans to 5 Democrats. The first is closer to the ideal ratio, but the second looks better to the eye.

We don't see this in the state map, as most of us don't know the geographic regions of North Carolina. So it isn't evident to us when most of these relations are broken. This creates a superficial appearance of fairness while actually creating an unfair result. Unfair to whom? Primarily the communities that get split without any recourse short of changing to a different algorithm.

Contrast this with a proportional method like Single Transferable Vote. There the voters get to choose how they group. Is ideology most important? Voters can pick ideologically similar representatives. Is local representation important? Then voters can pick representatives who live close to them (and define for themselves what close means). Minority voters can choose people with similar backgrounds. And voters can suggest how they'd like to compromise if their first choice doesn't make it.

One alternative is to let a totally impartial computer decide, based purely on census data and geography, with no details about the political (or other) makeup of the population. Brian Olsen's open source census-based B-districting algorithm aims for:

Across all districts and all people, The best district map is the one where people have the lowest average distance to the center of their district.

Comparative pictures, using North Carolina's House of Representatives districting. North Carolina using current method:

Picture of NC's jaggy rambling districts.

B-districting, based on 2010 census:

B-district NC picture, resembles patio stones.


(As a satirical gesture in lieu of posting to meta Brythan felt inspired to add the following interesting critique of B-districting. Unfortunately the critique relies on a usage of the term "community" that seems practically synonymous with current two-party districting, and includes an alphabetic diagram that I'm so far unable to decipher. -- agc)

Of course, this geometric compactness breaks geographic compactness, where neighbors who share a community are put in the same district. And of course they aren't necessarily fair. Geometric compactness does not protect minority representation. This shifts the battle from drawing the districts to picking the algorithm. Consider the following figure:

AAbbb  AAaaa
AAbbb  AAaaa
AAbbb  BBbbb
AAccb  BBbbb
AAccc  CCccc
DDccc  CCccc
DDcce  DDddd
DDeee  DDddd
DDeee  EEeee
DDeee  EEeee

Capital letters are Republican districts and lowercase letters are Democratic districts. Same map with two different districting plans. The five districts each have a letter.

If we define fair as a proportional result here, which is fairer? The proportion is two Republicans to three Democrats. The first is 3 to 2 Republican to Democrat. The second is 0 Republicans to 5 Democrats. The first is closer to the ideal ratio, but the second looks better to the eye.

We don't see this in the state map, as most of us don't know the geographic regions of North Carolina. So it isn't evident to us when most of these relations are broken. This creates a superficial appearance of fairness while actually creating an unfair result. Unfair to whom? Primarily the communities that get split without any recourse short of changing to a different algorithm.

Contrast this with a proportional method like Single Transferable Vote. There the voters get to choose how they group. Is ideology most important? Voters can pick ideologically similar representatives. Is local representation important? Then voters can pick representatives who live close to them (and define for themselves what close means). Minority voters can choose people with similar backgrounds. And voters can suggest how they'd like to compromise if their first choice doesn't make it.

Adding context as proposed at https://politics.stackexchange.com/questions/25931/why-do-some-poor-middle-class-people-support-trumps-tax-plan/25949?noredirect=1#comment92792_25949
Source Link
Brythan
  • 90.3k
  • 8
  • 221
  • 325

One alternative is to let a totally impartial computer decide, based purely on census data and geography, with no details about the political (or other) makeup of the population. Brian Olsen's open source census-based B-districting algorithm aims for:

Across all districts and all people, The best district map is the one where people have the lowest average distance to the center of their district.

Comparative pictures, using North Carolina's House of Representatives districting. North Carolina using current method:

Picture of NC's jaggy rambling districts.

B-districting, based on 2010 census:

B-district NC picture, resembles patio stones.

Of course, this geometric compactness breaks geographic compactness, where neighbors who share a community are put in the same district. And of course they aren't necessarily fair. Geometric compactness does not protect minority representation. This shifts the battle from drawing the districts to picking the algorithm. Consider the following figure:

AAbbb  AAaaa
AAbbb  AAaaa
AAbbb  BBbbb
AAccb  BBbbb
AAccc  CCccc
DDccc  CCccc
DDcce  DDddd
DDeee  DDddd
DDeee  EEeee
DDeee  EEeee

Capital letters are Republican districts and lowercase letters are Democratic districts. Same map with two different districting plans. The five districts each have a letter.

If we define fair as a proportional result here, which is fairer? The proportion is two Republicans to three Democrats. The first is 3 to 2 Republican to Democrat. The second is 0 Republicans to 5 Democrats. The first is closer to the ideal ratio, but the second looks better to the eye.

We don't see this in the state map, as most of us don't know the geographic regions of North Carolina. So it isn't evident to us when most of these relations are broken. This creates a superficial appearance of fairness while actually creating an unfair result. Unfair to whom? Primarily the communities that get split without any recourse short of changing to a different algorithm.

Contrast this with a proportional method like Single Transferable Vote. There the voters get to choose how they group. Is ideology most important? Voters can pick ideologically similar representatives. Is local representation important? Then voters can pick representatives who live close to them (and define for themselves what close means). Minority voters can choose people with similar backgrounds. And voters can suggest how they'd like to compromise if their first choice doesn't make it.

One alternative is to let a totally impartial computer decide, based purely on census data and geography, with no details about the political (or other) makeup of the population. Brian Olsen's open source census-based B-districting algorithm aims for:

Across all districts and all people, The best district map is the one where people have the lowest average distance to the center of their district.

Comparative pictures, using North Carolina's House of Representatives districting. North Carolina using current method:

Picture of NC's jaggy rambling districts.

B-districting, based on 2010 census:

B-district NC picture, resembles patio stones.

Of course, this geometric compactness breaks geographic compactness, where neighbors who share a community are put in the same district. And of course they aren't necessarily fair. Geometric compactness does not protect minority representation. This shifts the battle from drawing the districts to picking the algorithm. Consider the following figure:

AAbbb  AAaaa
AAbbb  AAaaa
AAbbb  BBbbb
AAccb  BBbbb
AAccc  CCccc
DDccc  CCccc
DDcce  DDddd
DDeee  DDddd
DDeee  EEeee
DDeee  EEeee

Capital letters are Republican districts and lowercase letters are Democratic districts. Same map with two different districting plans. The five districts each have a letter.

If we define fair as a proportional result here, which is fairer? The proportion is two Republicans to three Democrats. The first is 3 to 2 Republican to Democrat. The second is 0 Republicans to 5 Democrats. The first is closer to the ideal ratio, but the second looks better to the eye.

We don't see this in the state map, as most of us don't know the geographic regions of North Carolina. So it isn't evident to us when most of these relations are broken. This creates a superficial appearance of fairness while actually creating an unfair result. Unfair to whom? Primarily the communities that get split without any recourse short of changing to a different algorithm.

Contrast this with a proportional method like Single Transferable Vote. There the voters get to choose how they group. Is ideology most important? Voters can pick ideologically similar representatives. Is local representation important? Then voters can pick representatives who live close to them (and define for themselves what close means). Minority voters can choose people with similar backgrounds. And voters can suggest how they'd like to compromise if their first choice doesn't make it.

Elaborate a bit more on the background
Source Link
Bobson
  • 25.5k
  • 3
  • 72
  • 131
Loading
Noted that these are NC's HoR districts.
Source Link
agc
  • 13k
  • 4
  • 38
  • 73
Loading
Source Link
agc
  • 13k
  • 4
  • 38
  • 73
Loading