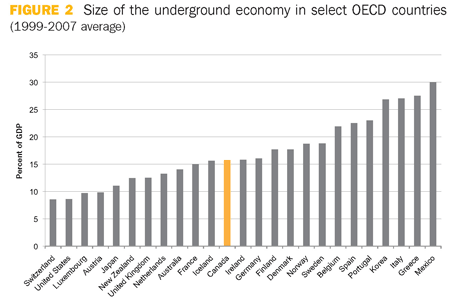
You didn't give a source for that picture so there is no way to know about the methodology used to calculate those figures.
Let's start with the shadow economy. Obviously it can only be guessed but a big problem is that some things are illegal in some countries and arn't in others.
What about the gun trade or prostitution? Switzerland and the US seem to have comparable shadow economies but prostitution is illegal in the US and isn't in Switzerland. So is there as much illegal gun trade in Switzerland as there is prostitution in the US (as % of the GDP, not in raw numbers, obviously)?
Then Canada has the weirdest law of all time: http://www.taxpage.com/Articles/illegal-income.html so how is that reflected? Assuming everyone does play by the rules and reports their illegal income the actual GDP is higher even though that growth is entirely financed through illegal means. Assuming nobody does is there a double counting with the illegal income and the tax evasion?
Opportunity is a big factor as well. How easy is it to get away with tax fraud (and how hard is the punishment) and how likely is it that all people will agree to do it (A plumber doesn't ask "Do you need a bill for that?" if he think that the other party will take offense to that and maybe even fill a complaint)
Then there is tax morale. If the government in the eye of the public doesn't seem to hold up it's side of the social contract then the incentive of not paying taxes raises. Thus depriving the government of funds and creating a vicious cycle.
For a more in-depth study (that ignores drugs/burglary/... - so all that concerns the average citizen) http://www.iea.org.uk/sites/default/files/publications/files/IEA%20Shadow%20Economy%20web%20rev%207.6.13.pdf
Now on to the GDP.
New offical EU regulation (though Greece already did parts of it to meet the criteria to join the Euro http://en.wikipedia.org/wiki/Economy_of_Greece#Eurozone_entry) is to include parts of the shadow economy in the GDP calculation. http://www.zerohedge.com/news/2014-05-22/hookers-and-blow-how-changing-definition-gdp-officially-jumped-shark
(Though that makes the levels more comparable. So I guess a positive effect?)
Then if you take a look at your picture all ratios are really close to each other. However, as the shadow economy is really hard to estimate:
Estimates of the size of the shadow economy by the MIMIC method
are generally thought to have a margin of error of +/–15 per cent
(that is, there is a probability of 95 per cent that the true value of
the shadow economy is between 8.5 per cent and 11.5 per cent of
national income if the estimated value is 10 per cent).
So the order might vary a bit (assuming that this method was also used in your picture)
Now for the conclusions:
Obviously the US (even though it's a bigger economy) archive a lower ratio because it's a ratio? (Size of shadow economy) / (GDP)? The actual sizes don't matter for the ordering.
But what about the top (or worst?) countries in this picture?
Korea's had a financial crisis just shortly before the time frame given (so a reduction in GDP) and then had to get a IMF bailout with the known consequences (weaker labor laws, higher taxes, financial restraint (so less social spending) -> The state provides less and thus the people need to keep more for themselves to balance that) which can erode trust in the state and thus make less likely that the full taxes are being payed.
Then there is high corruption / high interconnectivity between the big cooperations and the government
http://www.hofstra.edu/pdf/biz_MLC_Lee3.pdf
Mexico is plagued by the drug war and has the rich neighbor just across the border - doesn't lead to a favorable view of the state either.
Greece, Portugal and Spain were ruled by dictators up to the mid seventies. From that point on to the noughties there were various crisis (e.g. Oil crisis), IMF bailouts, ...
