The first past the post voting system favours large nationwide parties (in the UK the large nationwide parties in terms of members, funding and presence in the field are the Conservatives and Labour, to a lesser extent the LibDems) and small parties with strong support in clearly defined regions. The latter group contains almost all of the small or small-ish parties that hold seats in Westminster:
- The SNP in Scotland (although they have surpassed the LibDems in seats won last election so they happen to be the Third Party in the 2017 parliament)
- Sinn Féin and the DUP in Northern Ireland (the former do not take their seats but still won 7 of the 18 they contested indicating significant support for the absentionist policy) although it is important to note that the largest parties in Great Britain typically do not field candidates in Northern Irish constituencies; and
- Plaid Cymru in Wales
Lady Hermon, a Northern Irish indepent is somewhat of a special case: she was initially elected for the Ulster Unionist Party in 2001 but sat and stood as an independent candidate since 2010. She was obviously sufficiently popular in her constituency to continue getting elected even without party support, although the UUP would be another of the local Northern Irish parties. She is not standing for reelection in the 2019 election.
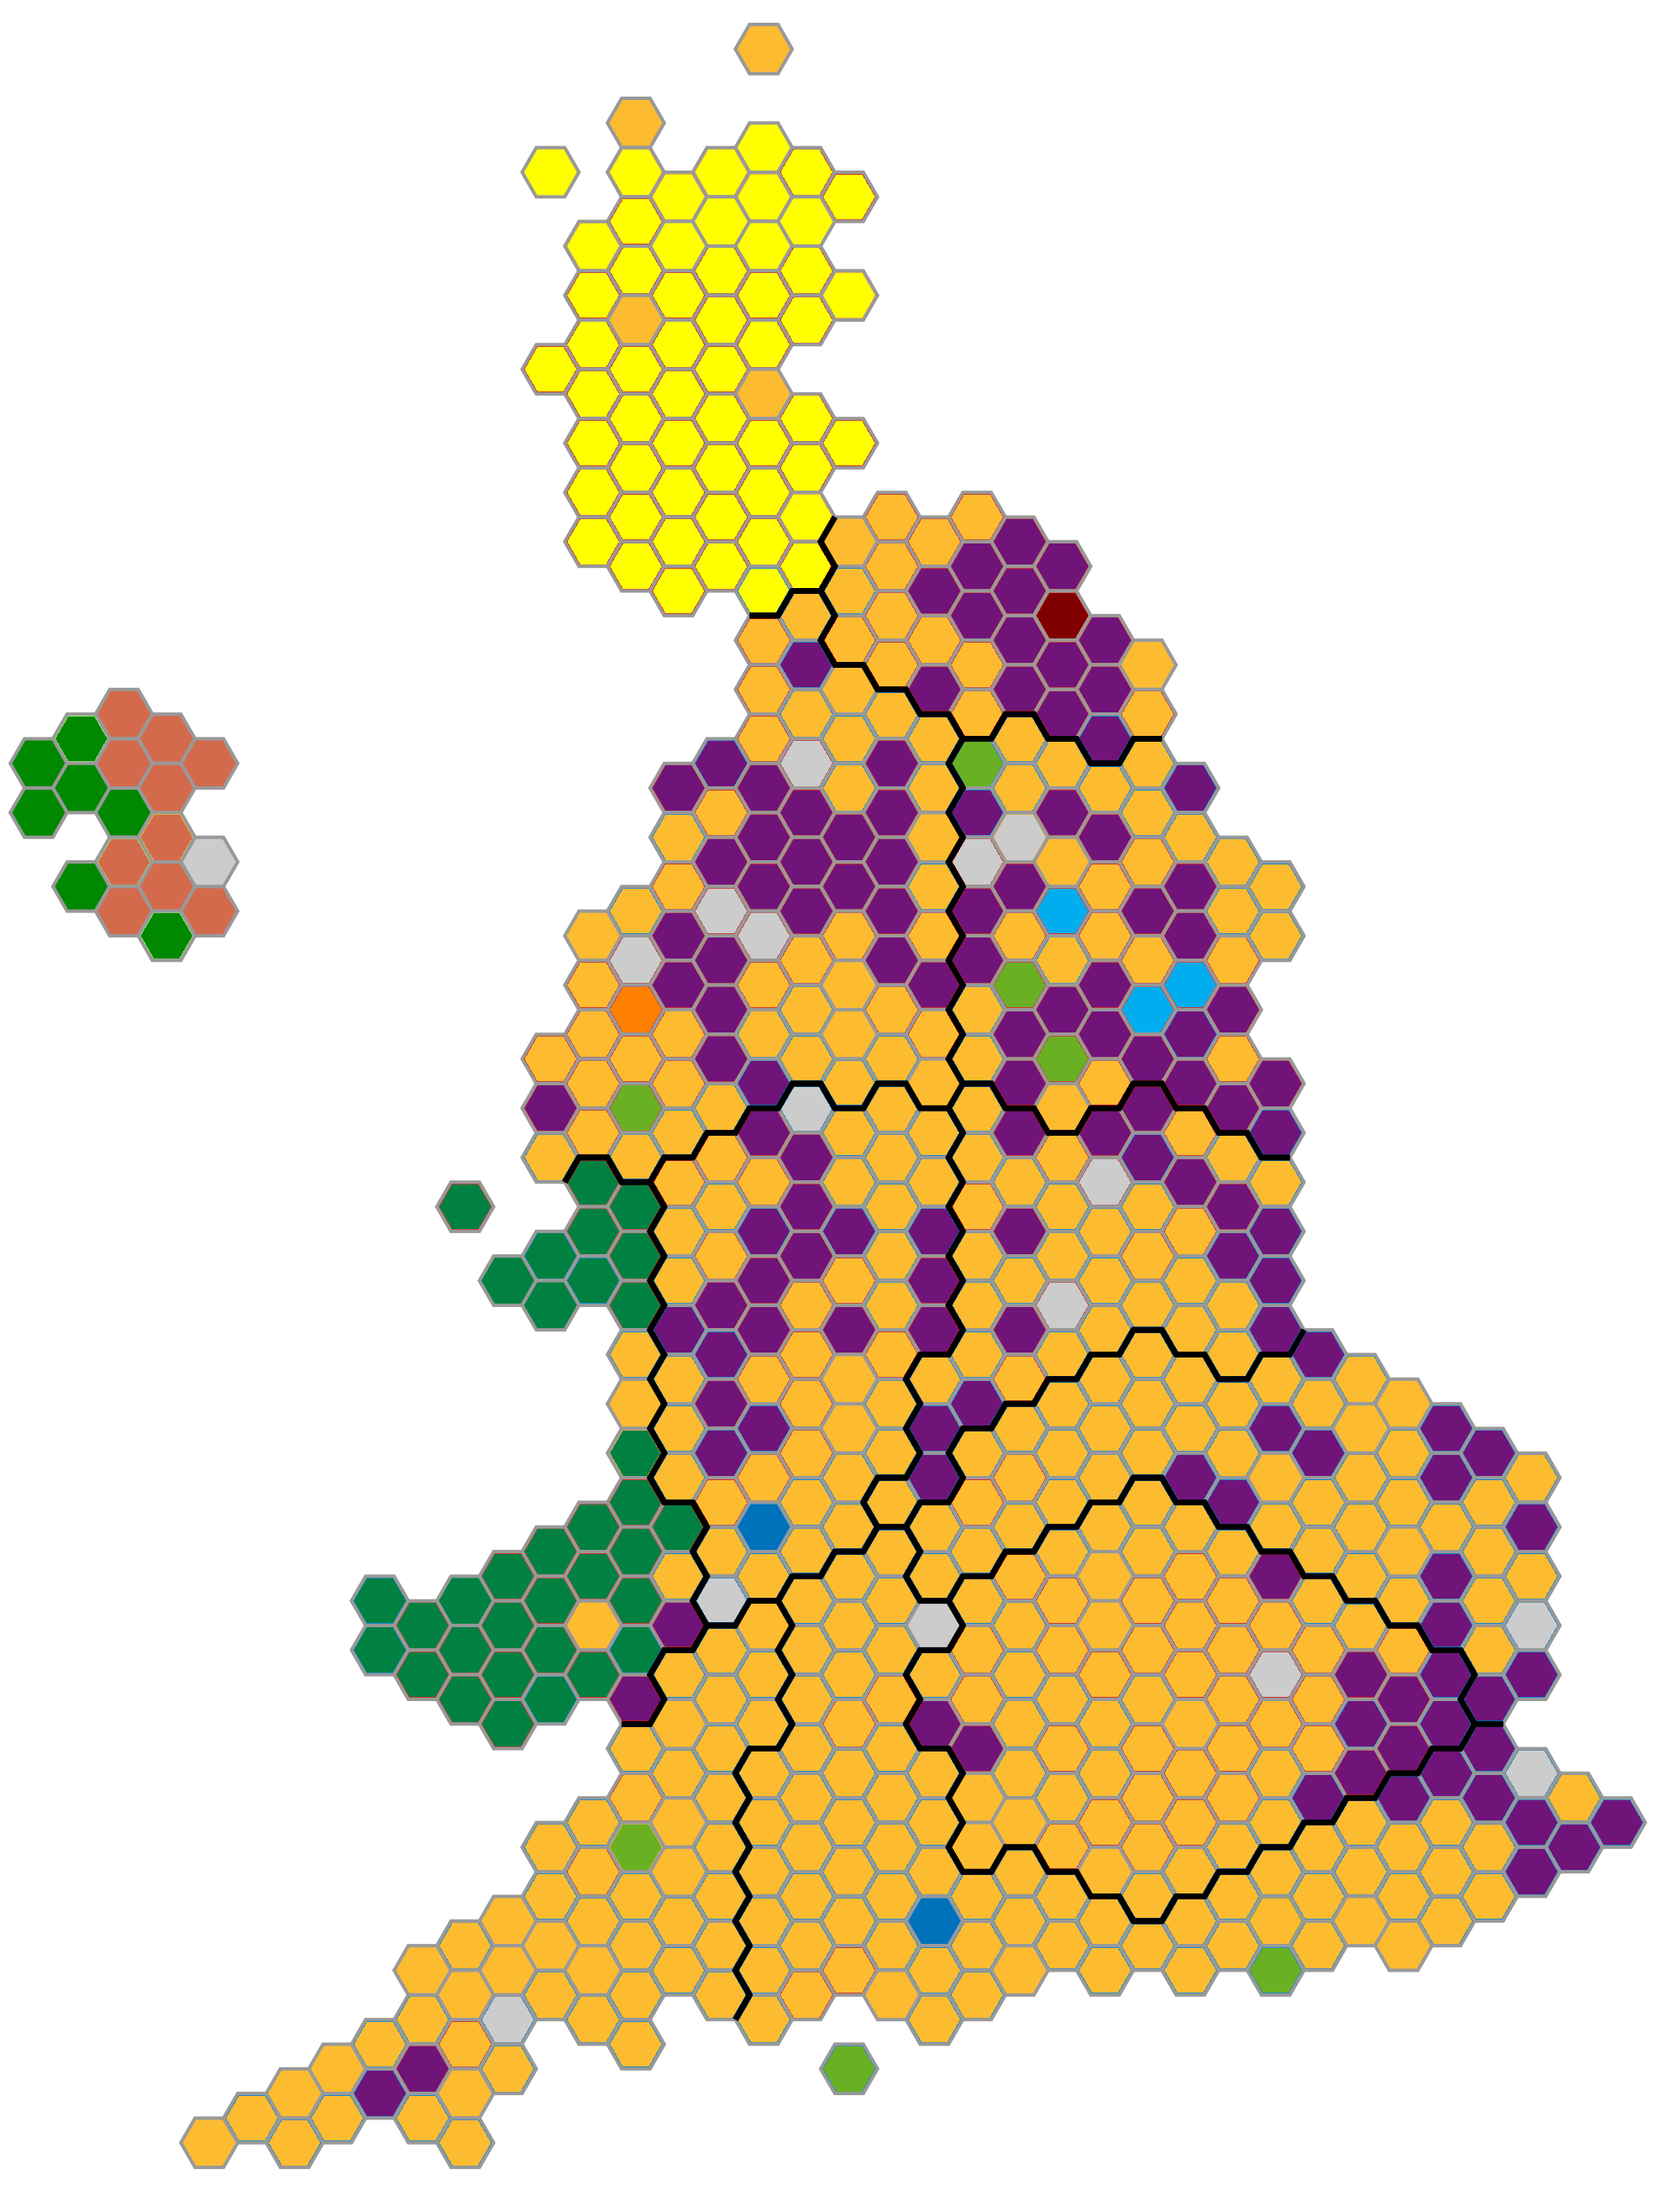
The Greens don’t have a clearly defined local stronghold base. If anything, Brighton Pavillion, the constituency of Caroline Lucas might be considered one as she won an absolute majority there in 2017 when she was still co-leader of the party. But if you take a look at the map of strongest third party by constituency below (taken from Wikipedia, where a full list of authors is available), you see that the strongest third party was LibDems or UKIP pretty much all across England.

Map of UK constituencies by strongest party that is not Labour or Conservative in the 2017 election. Colour code: orange = LibDems, purple = UKIP, light green = Green party, mid-green = Sinn Féin (NI only), dark green = Plaid Cymru (Wales only), dark blue = National Health Action, light blue = Yorkshire first (Yorkshire), brown = North East Party, yellow = SNP (Scotland only), the other colour in Northern Ireland = DUP (NI only), bright orange = Liberal Party
The map clearly shows how the SNP outscores everything that is not Labour or Conservative across most of Scotland while Plaid Cymru does the same in Wales. However, in Wales there was still much more support for the two main parties leading to Plaid Cymru only gaining 4 seats. The greens pop up in a number of unconnected constituencies as do some exceedingly minor parties in other places (whose names and colours I had to look up). While the UKIP was, at the time of the 2017 election, gaining traction all over England, they never managed to take over a seat from one of the two larger parties (one may argue how much of an opponent the LibDems were after their humiliating defeat in the 2015 election).
Thus, the non-proportional FPTP system favours a party such as the SNP but disfavours one like the Greens or the UKIP.
