3

538 did an article about the urban-rural divide. It said that in 2016, the correlation between urbanization and Dem voting was 0.69 in 2016 and 0.55 in 2012. (There was one big exception: Vermont.)

What was the correlation between the preliminary results and the urbanization index in the 2020 presidential election? I think I can ask now because there are enough results made so far. (538 said it increased, and I say I think it has as well but I want to make sure.)

1 Answer 1

5

Using 538's urbanization index from the linked article - which appears to have been calculated in 2019, as well as the preliminary results at time of writing according to Dave Leip's Election Atlas, we can investigate this.

As in 2016, we find a fairly strong positive correlation between FiveThirtyEight's urbanization index and the two-party vote share in the state. The correlation coefficient between the two variables is ~0.66, and the approximate linear trend-line plotted in blue on the graph below has a gradient of ~13.2. This compares to the correlation coefficient reported by FiveThirtyEight of 0.69 in 2016; while the coefficient has reduced in magnitude, it is such a small change that I'm unsure we can draw many conclusions from this.

Vermont is once again the only outlier, with a studentized residual of 3.87; the state voted overwhelmingly for Joe Biden, with a two-party advantage of D+36.6, despite having a low urbanization index of 8.84. Florida was, again, the most urbanized state to vote for Donald Trump.
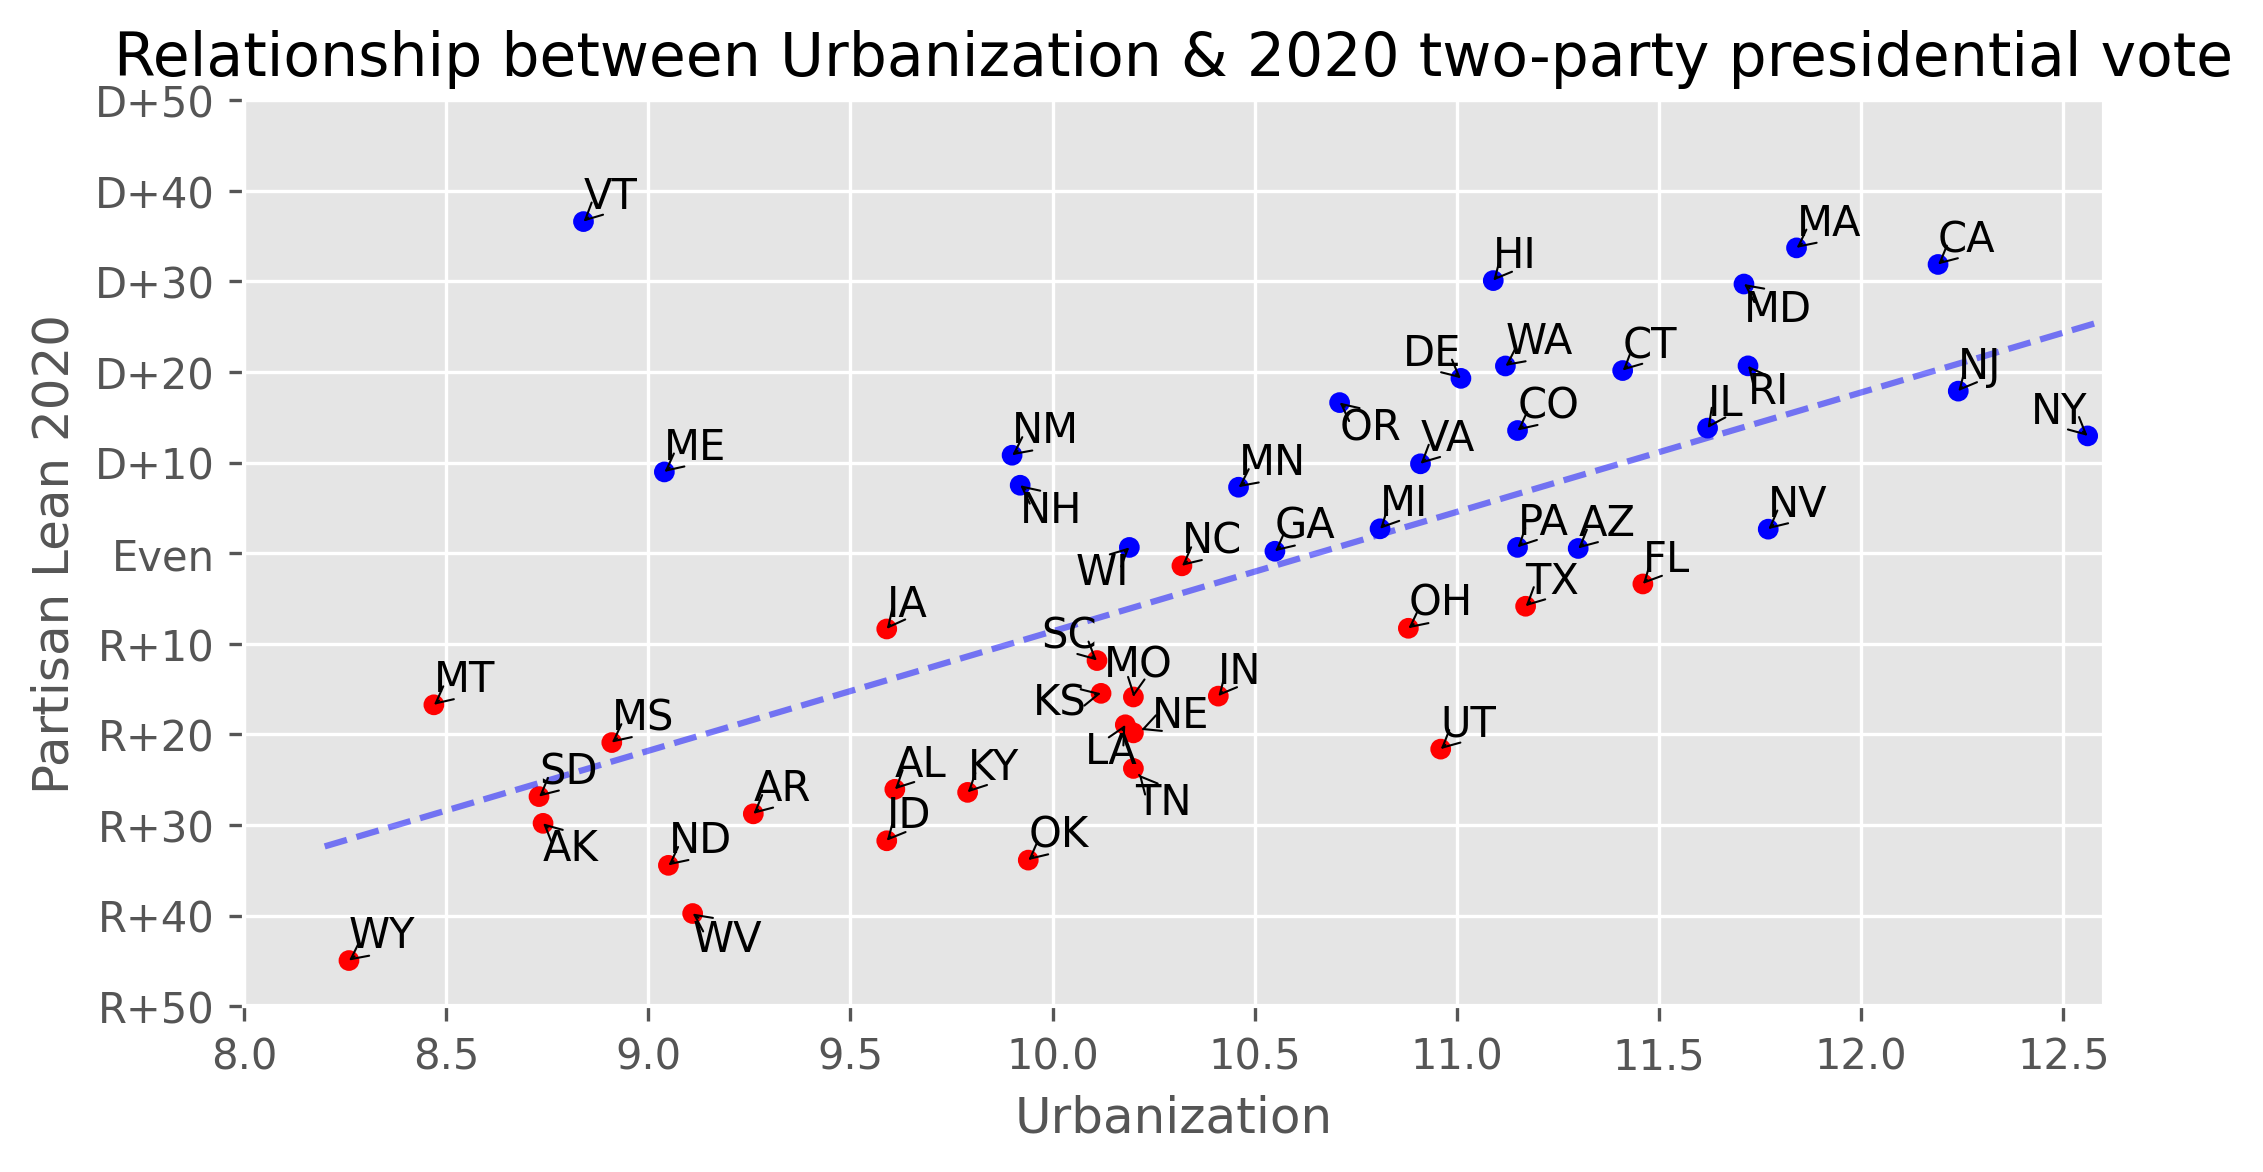
enter image description here

Running the numbers on the 2016 presidential vote margins myself, rather than relying on the article, I get a correlation coefficient of 0.68, so pretty much the same as the article's calculation. The gradient of the trend line is slightly steeper than in 2020, at ~13.9.

enter image description here

The code used in this answer can be found on GitHub.

7
  • I understand the question didn't ask about it, but how did the beta for urbanization change? That would be useful to add. As for a change of 0.03, I have seen people say to not even report r values past one decimal place, so i agree there's not much of a conclusion there (esp. considering partisan lean is incomplete). Commented Nov 9, 2020 at 20:01
  • 1
    @AzorAhai-him- I've updated with a further comparison to 2016 :)
    – CDJB
    Commented Nov 10, 2020 at 9:12
  • 1
    Interesting outliers with Vermont and Maine, see also: politics.stackexchange.com/q/49527/130
    – gerrit
    Commented Nov 10, 2020 at 16:03
  • I suspect that a lot of the variation form the urbanization index could be explained with a North-South dummy variable which basically would capture the fact that whites in the South are pretty much single party voters while there is more political variance among Northern white voters.
    – ohwilleke
    Commented Nov 10, 2020 at 20:49
  • Why does Dave Leip defy convention and mark Democrats red and Republicans blue, I wonder.
    – ohwilleke
    Commented Nov 10, 2020 at 21:34

You must log in to answer this question.

Not the answer you're looking for? Browse other questions tagged .