I have read from a Bloomberg article that the North Korea economy has expanded by 1.8% according to the United Nations. However, I know the North Korean government is secretive with information about its economy and releasing information about its economic activities. How was the United Nations able to get enough information about North Korea's economy to gain general information about it, let alone know enough about it to publish how much it has grown?
2 Answers
I'm not sure about this year, but for 2017 the figure from the UN WESP report (-3.5%, table A.3) coincides with the one from BOK (the Bank of South Korea), which regularly publishes such statistics, although not always with summaries in English. The BOK is not terribly transparent about their source data
basic data on production quantities supplied by relevant institutions
I've read somewhere else that that basically means the South's intelligence agencies.
South Korea’s central bank—considered the most authoritative source for North Korean economic data—uses figures compiled by the government and intelligence agencies to make estimates. That includes everything from water flows at dams to smoke coming out of chimneys to the size of rice paddy crops, according to Lee Seog-Ki, senior research fellow at the Korea Institute for Industrial Economics & Trade, a think tank run by South Korea’s trade industry.
I also found the BOK 2018 report on that (which does have a minor difference from the UN one, possibly due to different rounding) and it's helpful to compare the other figures too (top line BOK, bottom UN):
The UN report doesn't get into any details how they get NK data. If we go by the 2019 schedule, BOK will not publicly release their data for NK 2019 until July this year (2020). (That doesn't exclude they may have communicated a preliminary version privately to interested researchers elsewhere.)
As an aside, and if you're curios, the CIA's World Factbook provides only much coarser data.
North Korea does not publish reliable National Income Accounts data; the data shown are derived from purchasing power parity (PPP) GDP estimates that were made by Angus MADDISON in a study conducted for the OECD; his figure for 1999 was extrapolated to 2015 using estimated real growth rates for North Korea's GDP and an inflation factor based on the US GDP deflator; the results were rounded to the nearest $10 billion.
The CIA factbook also gives these, but no mention on how they were obtained (they happen to coincide with BOK data as well):
GDP - real growth rate:
-1.1% (2015 est.)
1% (2014 est.)
1.1% (2013 est.)
I don't know about the United Nations specifically, but (as hinted at in Fizz' answer) remote sensing offers multiple methods that can be used to estimate the size of an economy:
- Agricultural land use as well as the construction of roads, factories etc can be seen on satellite images
- Emissions from industrial activity can be measured and compared over time. Here is an article that shows how the levels of nitrogen dioxide dropped because of the Covid-19 outbreak and associated lockdowns around the world: https://www.theguardian.com/environment/2020/mar/23/coronavirus-pandemic-leading-to-huge-drop-in-air-pollution
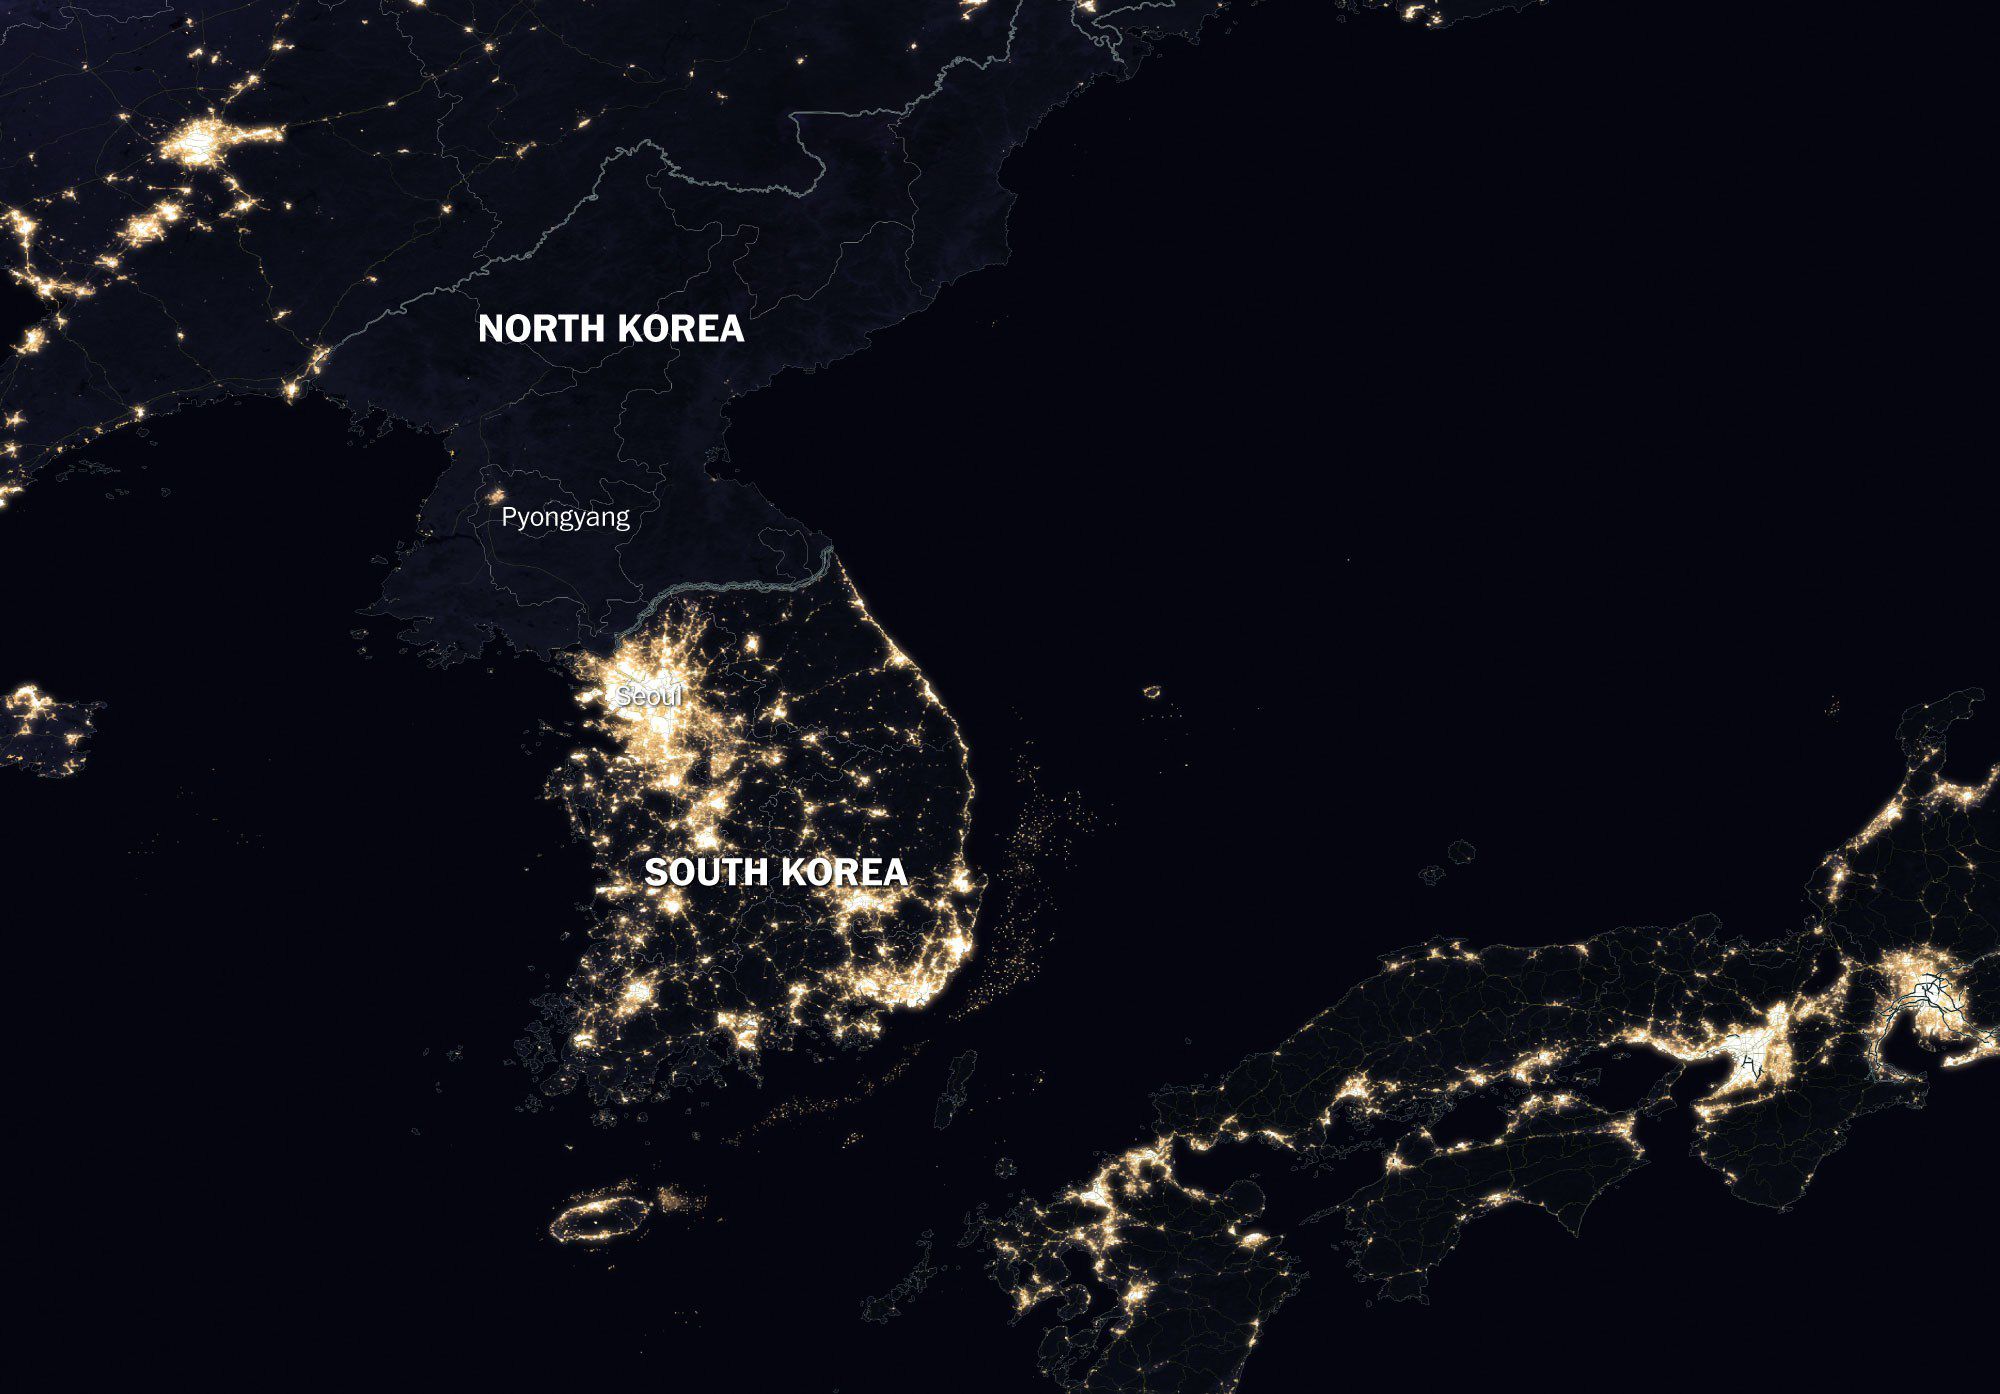
- A particularly nifty way of estimating economic activity involves measuring changes in nocturnal luminosity (night lights). Here are two articles that specifically talk about the case of North Korea: https://www.imf.org/external/pubs/ft/fandd/2019/09/satellite-images-at-night-and-economic-growth-yao.htm, https://www.economist.com/graphic-detail/2019/05/04/satellite-data-shed-new-light-on-north-koreas-opaque-economy (paywalled). Here is a real satellite image which shows the difference in luminosity between North and South Korea, courtesy of the Washington Post:

