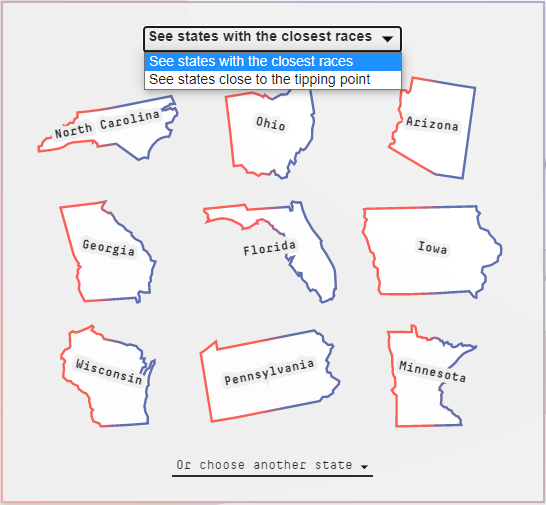
In 538's Election Forecast, states are highlighted as either having "the closest races" or being "close to the tipping point". What is the difference between these two categories?
2 Answers
To demonstrate the difference, I'm going to use the result of the 2008 election as an example.
A close race is a race where the difference between the two candidates is small. In 2008, Missouri was the closest race (in percentage point terms), which McCain won by 0.14%. As we know, though, Obama didn't need Missouri to win that election.
The tipping point state is one where, when you sort the states from most Democratic to most Republican, gives the winning candidate their 270th electoral vote. In 2008, this state would have been Colorado; even though Obama won that state by nearly 9%, that's the state that gave him the win in the end.
-
6Do you have any support for that interpretation? That's not how it's usually used, and it's of little relevance. All states that voted for Obama helped give him the win. Colorado didn't have a special role. Commented Aug 18, 2020 at 19:35
-
10I'm a regular listener of their politics podcast, where this is often discussed, does that count?– Joe CCommented Aug 18, 2020 at 19:46
-
1@Acccumulation - the relevance of Colorado is: any special efforts that the Obama campaign put into states more conservative than Colorado was "wasted." Campaign stops, and advertisements in local markets use limited resources. In 2020, Ohio is currently polling at 50-49, Trump, so it's close. But Biden probably should not invest too much time / money in Ohio, as he can comfortably win with states that are to it's left. 538 currently lists Ohio as the tipping point in 2.8% of simulations. But Biden should put more into OH than say, TX, which is even less likely to be the tipping point (<1%) Commented Aug 19, 2020 at 17:05
-
2@Acccumulation: In case you haven’t already seen, the answer has now been edited with a link to a source, where fivethirtyeight explain precisely what they mean by the “tipping point state”. Commented Aug 19, 2020 at 23:12
There are some nuances particular to FiveThirtyEight's model. Their dashboard works by simulating a large number of elections, and then presents a sample of 100 of these simulations.
The states with the closest races are those where the number of simulations each candidate is predicted to win the state is closest to 50 each. Examples are North Carolina (51 Trump wins, 49 Biden wins), Ohio (55 Trump wins, 45 Biden wins), or Arizona (45 Trump wins, 55 Biden wins).
The states which are designated as being close to the 'tipping point', are calculated by lining up the states in order of victory margin in each simulation. The state which takes the winning candidate over 270 electoral votes is the tipping point state for that election. After all the simulations are complete, the states are given scores based on the percentage of simulations in which they were the tipping point state. In their current model, the states which gained this title most frequently are Pennsylvania and Florida (both 22.3%), and Wisconsin (10.8%).
