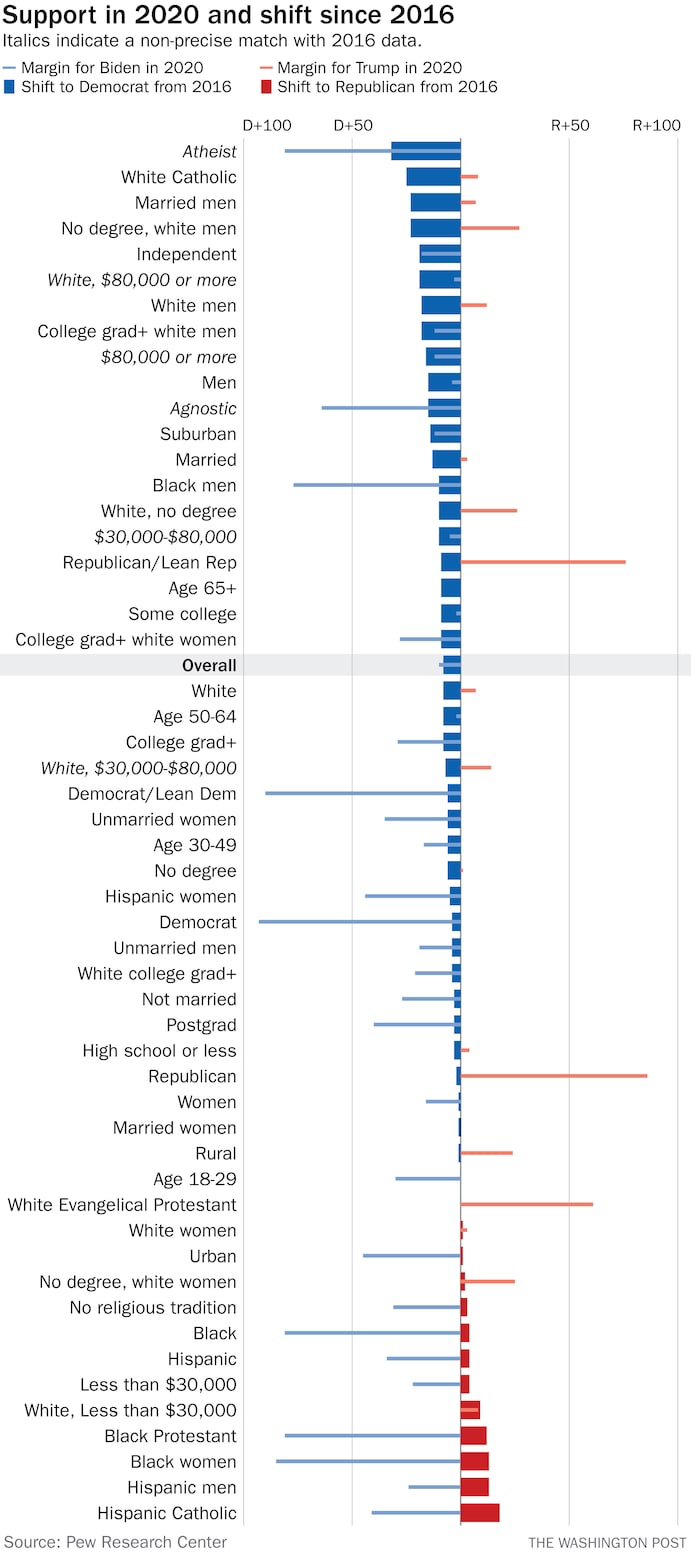
This article has an image showing shifts in support between 2016 and 2020. Where does this figure come from? While it says Pew Research Center, I can't find this figure on their site.
1 Answer
My best guess is that The Washington Post made that figure using data from the two Pew Research surveys they link to in the paragraph preceding the figure:
An examination of the 2016 electorate, based on validated voters from August 9, 2018, and
Amid Campaign Turmoil, Biden Holds Wide Leads on Coronavirus, Unifying the Country from October, 9th 2020.
My evidence for this is: 1) that the figure doesn't appear in either article and 2) the figure contains some non-precise matches between the 2016 and 2020 data, which are shown in italics
-
2Media outlets do usually usually make their own graphics in their own style. Commented Oct 13, 2020 at 2:34
