In the United States as well as parts of Latin America from what I've
read, identifying as non-white is often on average associated with
more liberal views
Your intuition is correct. Racial identification drives voting tendencies in the direction you suspect. Religious adherence, and whether someone is native born or not, are also significant drivers of voting tendencies.
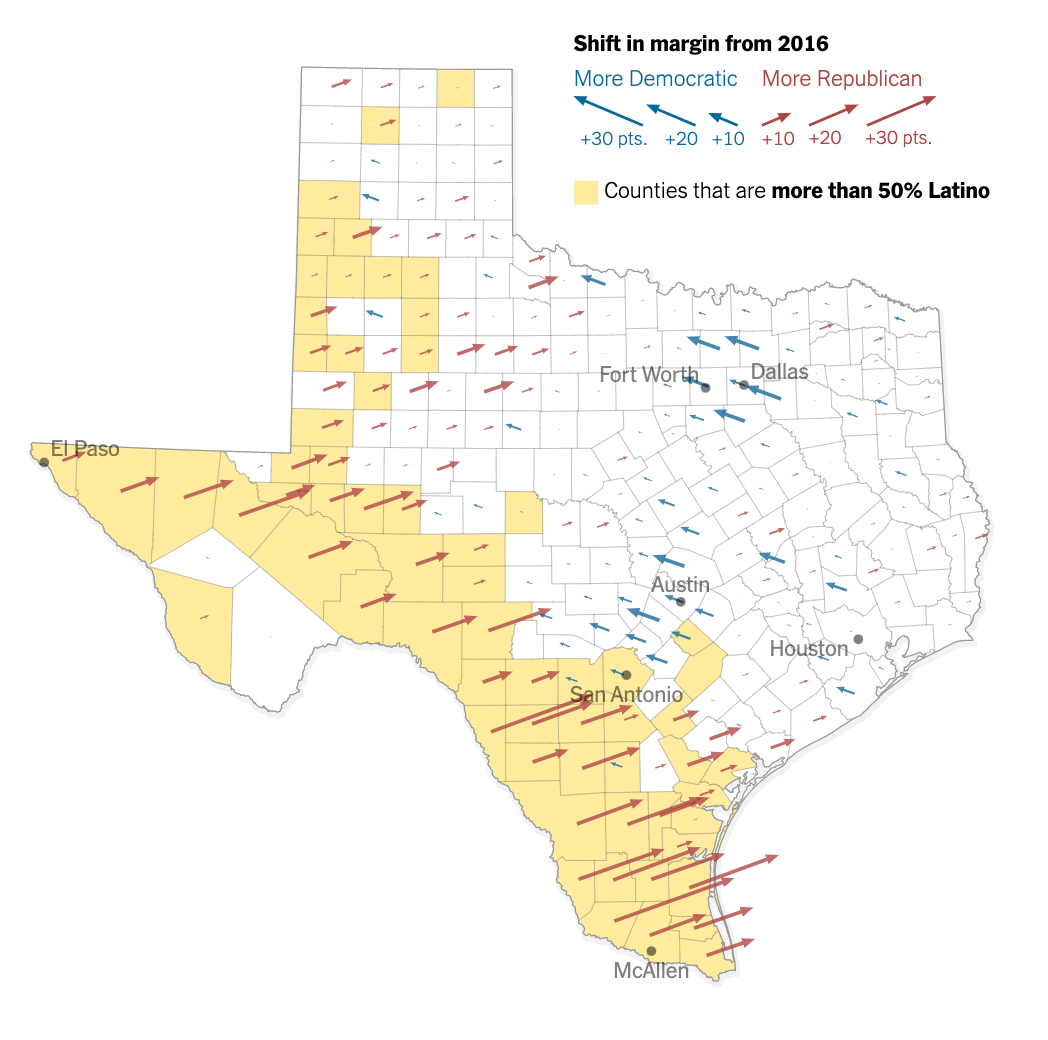
One of the notable trends in the 2020 election was a shift away from Democrats and towards Republicans among Hispanic voters in several specific areas among non-college educated Hispanic voters, especially, the Miami, Florida metro area, near the Texas border with Mexico, in certain already conservative leaning areas in California, and arguably in Southern New Mexico (although more than one facto was at play in that case). According to the second link in this paragraph (to the New York Times):
Mr. Trump’s most sizable gains outside of Miami were in the Rio Grande
Valley in the predominantly Hispanic areas along the border with
Mexico, including Hidalgo County, home to McAllen.

For example, in the 2020 U.S. House races, Democrats lost 1% of their "safe Democratic" seats (as rated by Cook's Political Report) and about half (± one seat) of the "Vulnerable Democrat" seats. Five of the seats (three in California, two in Southern Florida and one in New Mexico with a somewhat more complicated story) seem to reflect GOP strength in 2020 with certain Hispanic communities. Democrats lost CA-21 (open seat, Fresno, 71% Hispanic), CA-39 (safe, suburban LA, 34% white, 33% Hispanic, 29% Asian), CA-48 (Laguna Beach, 59% white, 20% Hispanic, 18% Asian), FL-26 (Miami, 72% Hispanic), FL-27 (safe, suburban Miami, 72% Hispanic), and NM-2 (Southern NM including Las Cruces, 27% Hispanic, 6% Native American).
In all three of those places, the Hispanic voters shifting to vote for Republicans overwhelmingly identify as white first, and Hispanic second, even in cases where they are fully bilingual (a particularly good profile can be found at Politico). (It isn't entirely clear if this self-identification reflects predominantly European ancestry as it does for Cubans in Florida, or if it is a matter of self-perception among people with significant Mestizo ancestry.)
Religion And Foreign Born Status
These populations also tend to have a low share of first or 1.5 generation immigrants. (A "1.5" generation immigrant is someone who like a first generation immigrant is foreign born, but migrated to the U.S. as a child where they were raised by first generation immigrants, but are fully assimilated in U.S. culture and usually fluent in both the language of their parents and American English.)
Another factor distinguishing the voting tendencies of Hispanic voters both in Latin America and in the U.S. is religious affiliation. On average, Hispanic Protestants (most often Pentecostals) are significantly more conservative politically than Hispanic Catholics, and non-religious Hispanics are less liberal than Protestant Hispanics but only moderately so, although this last distinction in confounded by the fact that foreign born Hispanics are overwhelming Christians of some sort or another, while non-religious Hispanics are much more likely to be U.S. born.
Latino voters were 50% Catholic, 25% Protestant/Other Christian, 6% Other Religious Affiliation and 20% No Religious Affiliation in the CNN Exit polls in 2020 and according to the same poll, Latino support for Biden (in the 18 states with statistically significant samples) ranged from a low of 53% in Florida to a high of 75% in New York State, while Latino support for Biden was highest among Catholics 71%, then those with no religious affiliation 55%, and then Protestants 51%. According to the Associated Press Votecast Exit polls 65% of Latino Catholics voted for Biden.
A significant share of the U.S. born Hispanic population in Texas, New Mexico, and Southern Colorado have ancestors in the same place who lived there before the area was part of the United States. Indeed, the dialect of Spanish spoken in New Mexico and Southern Colorado (see also here) by these populations retains certain words and grammatical features from the colonial era that have not been retained in any other Spanish speaking place. Also, a century ago, these pre-U.S. origins Hispanics included a significant share of Sephardi Jews, although that religious affiliation is now extremely rare in these places due to migration and conversion.
