Corporate profits vs. salaries
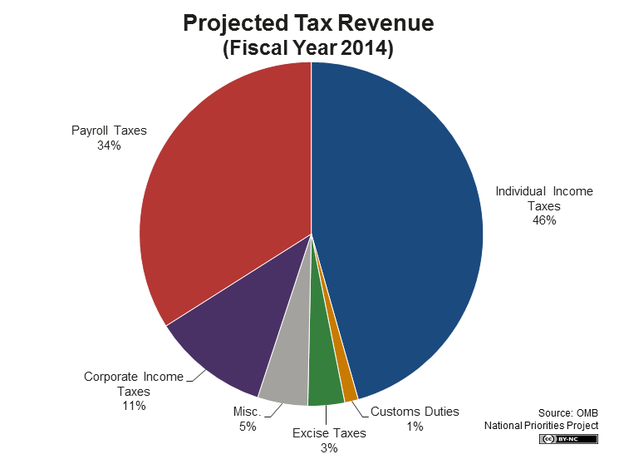
If you compare corporate profits to employee compensation, employee compensation is about four times as large. Corporate income tax is on an alternative measure of profits. Personal income and payroll taxes are on a modified version of employee compensation.
Payroll taxes
Payroll taxes used to be evenly divided between an employer and employee share. More recent changes (Obamacare) changed that slightly, but corporations still pay a significant portion of payroll taxes. The implication of the graph seems to be that those are all individual taxes.
Note that not all of the employer share is paid by corporations. But all of the corporate share would show up in the general bucket.
Dividends as personal income
Corporations pay dividends to shareholders who are then taxed on them. This is clearly corporate generated wealth, but it shows up in the graph as individual income. Capital gains on stocks are similar. The wealth may be generated by the corporation, but the profit goes to some individual who pays the tax.
Subchapter S corporations
Subchapter S corporations, partnerships, and sole proprietorships have profits that are passed through to the individual(s) as income. So they'd show under personal income taxes not corporate taxes.
US rates
The United States has a particularly high corporate tax rate, nominally one of the highest in the world. As a result, US corporations are exceptionally aggressive about structuring their income so as to avoid income. The net result is that the US effective tax rate is slightly lower than average among OECD countries (27.1% to 27.7%).
You can use this either way. Corporations in the US pay a similar rate to corporations elsewhere or corporations in the US have more incentive to make income not show at all (which wouldn't show in the statistics if it were happening).
Corporate taxes as individual taxes
Corporations are a legal fiction. They do not actually exist. We use them as a convenience because some interactions are difficult to describe without them. For example, corporate ownership is much more complicated than a typical partnership. Legal liability is deliberately simpler than a partnership (owners of a corporation have limited liability). And employment relations would be well nigh impossible to describe.
Consider a typical employee of a GM factory. That person only contributes a fraction of the labor for each car. And the compensation is complicated. A paycheck, healthcare, retirement, other benefits, overhead, income tax withholding, unemployment, worker's compensation, Social Security tax, and Medicare tax. Isn't it simpler to just write one check to your local dealer who pays GM who pays hundreds of workers involved? But that hides the complexities involved. Who pays taxes? The purchaser of the car (all the money comes from them). The employees who get the lion's share (more than half) of the purchase price? The owners? The fictional entity we call GM?
How much of a difference does it make?
Note that it is unclear how much of a difference this makes. For example, if we assume that 80% of corporate wealth creation goes to employees and only 20% to shareholders (who may also be employees), that in and of itself would justify more taxes paid by individuals. But it wouldn't explain an 80 to 11 discrepancy.
Moving half of the payroll taxes from the individual bucket to the corporate bucket would overweight corporate taxes, 63 to 28. That's a 9:4 ratio but should be 4:1 by the previous thesis. However, payroll taxes are no longer evenly divided. And not all employers are corporations. But all corporate taxes are paid by corporations. So all of the 11% is paid by corporations plus some of what appears in the payroll and individual wedges.
We certainly can't tease out this effect by looking at the graph, even with knowledge of what each pie wedge means. I don't know of a public data source that breaks down the information in the necessary way. Perhaps it exists. Perhaps not. Certainly private data would cover this. The IRS knows who pays what tax.
Summary
I would reject the assertion that most wealth is created by corporations. To the extent that is true, some of the wealth is passed to individuals before being taxed. Thus leaving the graph showing more taxes paid by individuals than corporations. This is particularly true since it counts the employer share of payroll taxes against the individual employee.
 , which is sourced from: President Obama Proposes 2014 Budget