I did find a survey published nearly 20 years ago. To begin with, the issue methodology (i.e. metric to use) is actually not entirely trivial...
How can we measure the degree of malapportionment across electoral
systems? Ratios of largest-to-smallest districts might seem an obvious means
for assessing malapportionment. However, such ratios actually prove poor
indicators of malapportionment. First, district size on the basis of population
tells us little about the degree to which districts are underrepresented or
overrepresented: we also need to know how many seats are allocated to each
district. Furthermore, even if we know how many seats are held by the largest
and smallest districts and can therefore calculate ratios of ‘worst represented’
to ‘best represented’ districts, such ratios tell us little about overall degrees of
malapportionment. For example, even if this ratio is 50:1 (e.g., a single-member
district system in which the largest district has a population fifty times greater
than the smallest district), [footnote: This is the case in India, where in 1991 the largest district for the national lower chamber (Thane)
had a population of 1,744,592, whereas the smallest district (Lakshadweep) had a population of just 31,665.] all other districts may have nearly-equivalent
populations, and, hence, the largest and smallest districts could be extreme
outliers in a system with a low degree of average malapportionment. Although
it may be tempting to interpret wide gaps between the best and worst represented
districts as signs of high overall levels of inequality in electoral systems, a better
measure is required. With one important modification, the Loosemore–Hanby index of electoral
disproportionality (D) provides such a measure.
The modification is straightforward in that instead of using votes cast and seats obtained one uses (as in the standard LH index)
one takes the absolute value of the difference between each district’s seat and population shares
Well... it's simple enough for single-tier districts (like for instance both US House and Senate have). They have a more complicated algorithm formula for multi-tier districts (like Germany's Bundestag has), which I won't get into the details thereof here... it's more or less a recursive application of the same idea. Regarding bicameral systems, they don't attempt to evaluate cross-cutting
malapportionment, i.e. each chamber is evaluated separately. (Nothing special needs to be done to account for multi-member districts [coded (as not) SMD in the tables below], the basic formula handles that.) As for the results:
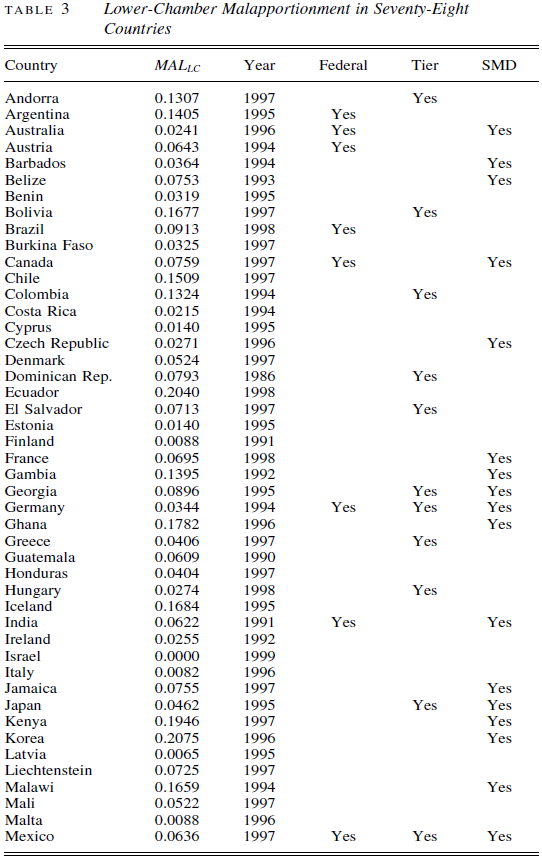
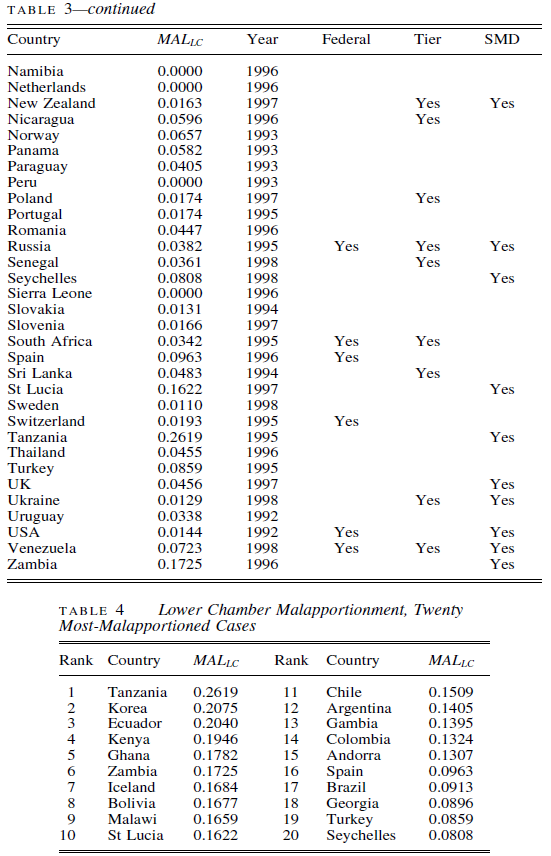
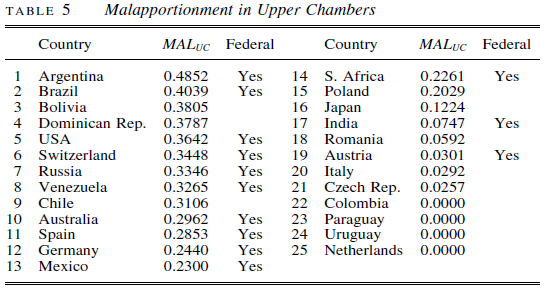
They also ran a regression on the determinants/correlates of malapportionment; they found e.g. that single-member district lower chambers are usually more malapportioned.
Likewise for upper chambers in federal systems (hardly surprising).
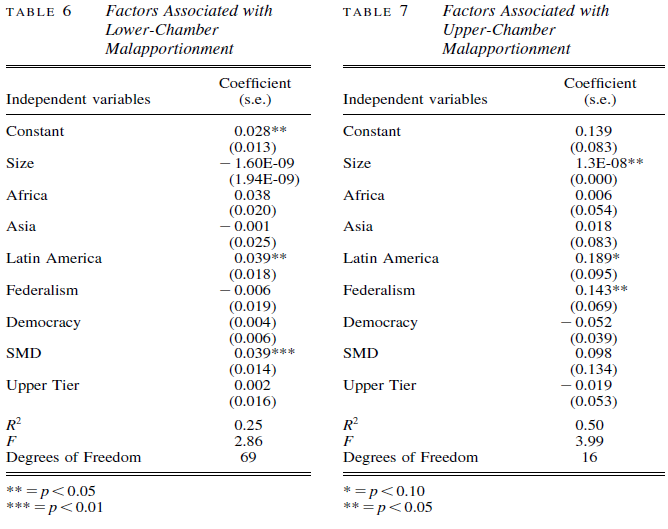
They do have this interesting comment on multi-tier (Bundestag style) systems not being actually effective on average at reducing malapportionment:
In particular, note that the ‘upper tier’ variable is not
significant. That is, although upper tiers mathematically reduce malapportionment,
in reality the level of malapportionment in the lower tier in many multi-tier systems may be large enough to override the mitigating effects of the upper
tier. Thus the use of tiers is not in fact associated with lower malapportionment.
Note that this does not meat that multi-tiering was not somewhat effective in relative terms, e.g.
If the Bundestag did not have an upper tier, malapportionment would
double, increasing from 3 per cent to 6 per cent.
(The Bundestag system was reformed in 2013, so those figures probably aren't correct anymore.)
Geographically, they noted that Latin American countries generally had above-average malapportionment.
There is a newer (2014) paper by two Japanese researchers that updates on the aforementioned one and also uses three metrics instead of one...
First, we provide the most extensive dataset of malapportionment currently available, accumulating data from 83 countries and 216 elections. This dataset compares the following measures of malapportionment: (1) the Loosemore–Hanby index-based measure provided in Samuels and Snyder (2001), called MALSS, in this study, (2) the ratio of largest-to-smallest districts, or the max–min ratio (MALMAXMIN), and (3) MALGINI, which employs the calculation method of the Gini index. Our analyses show that MALSS and MALGINI are highly correlated, but MALMAXMIN yields a highly different value in comparison with MALSS and MALGINI.
As for the motivation to expand the metrics used...
MALMAXMIN is a frequently used method among practitioners such as lawyers
and journalists. For instance, the Supreme Court of Japan ruled that the current
delimitation scheme is an “unconstitutional situation.” This ruling was based on the
ratio between the number of voters in the largest and smallest districts which was 1:2.34 in 2013. Journalists and citizens groups often use this measurement method as it
is intuitive and easy to calculate. Samuels and Snyder (2001) dismiss the method as
“poor” (p. 654) because it only calculates outliers even when the rest of the districts
have the same number of voters and fails to assess the whole picture. Against this
backdrop, we still include this method in our study because it was crucial to know up to
what extent this method deviates from the overall picture. In fact, no studies in our
knowledge use the method of MALMAXMIN for a large number of countries.
Interestingly they note that in the case of Japan, one reform reduced the extreme, but slightly increased average malapportionment.
In 1984,
the Supreme Court ruled that the delimitation plan used for the previous lower house
election of 1983 was unconstitutional as MALMAXMIN reached 4.4. The Liberal
Democratic Party which was then in power, reformed the districting scheme in response
to the verdict. However, their reform was targeted to reduce the level of MALMAXMIN
but not the disparity in the count at large. In Japan’s next election of 1986, MALMAXMIN
was reduced to 2.92, but MALSS increased from 0.158 in 1983 to 0.164 in 1986.
Actually they have a table with worst cases (only for lower chambers) using the three methods:
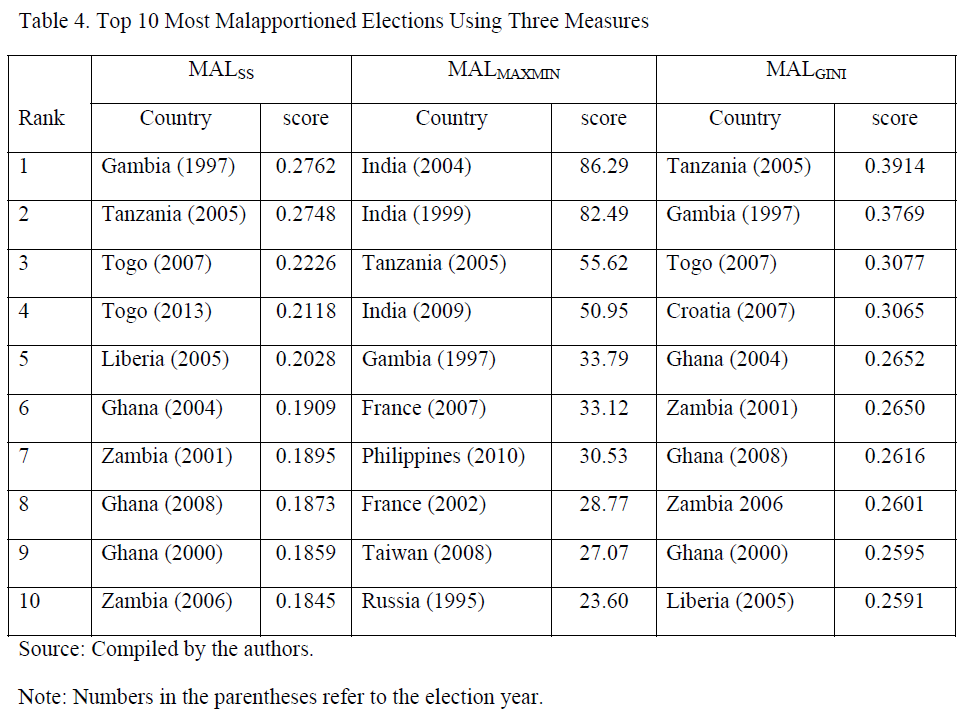
The correlation between the "MALSS" (LH index) and the Gini index method was very high (0.95), but MALSS only correlates 0.42 with the extremes metric. (The third index is a "political Gini", it doesn't use wealth or income as the more usual measure you may have heard of.)
There's actually one significant methodological departure in this paper compared to the previous one, namely the use of eligible voters instead of total population in the district(s). In the authors' words:
In calculating the three MAL measures, we use the number of electorates,
rather than the population size in each constituency. [footnote: In this study, we use the terms “electorates,” “eligible voters,” and “registered voters”
interchangeably.] Samuels and Snyder (2001)
mainly employ the population size, because, according to them, most countries’
delimitation rule is based on a population census rather than the number of eligible
voters. We believe it is more accurate to use the number of electorates because countries
differ with regards to the qualification standards to be eligible to vote. In other words,
countries with the same population size can have different numbers of electorates
depending on how the qualification standards are set.
They don't mention this, but the substitution of eligible voters for total [district] population also makes the method need rely only on election [published] data, without needing any separate census data, which explains in part why they managed to expand the dataset a fair bit.
They also include more African countries in their dataset (probably helped by previously mentioned change), so in most of the regression models they ran (which are too numerous to list/discuss here) both Africa and Latin America were above average in malapportionment.


