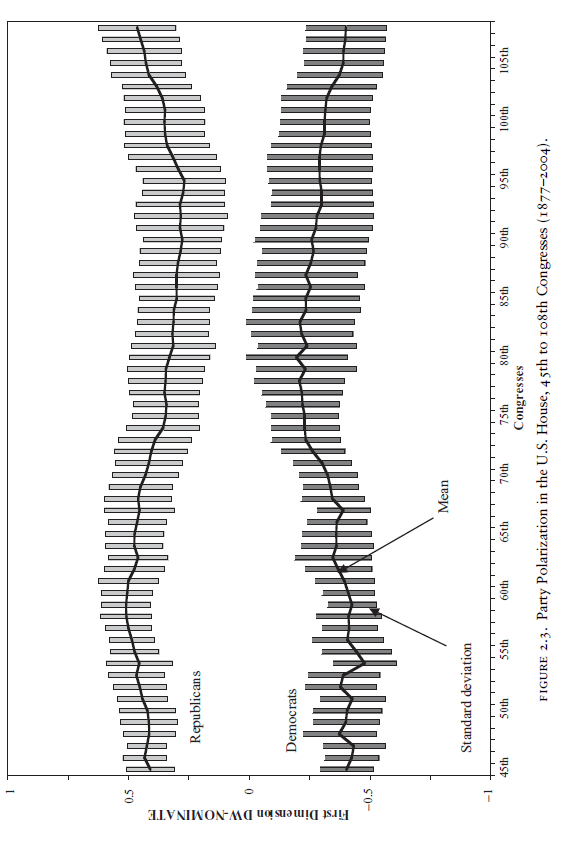
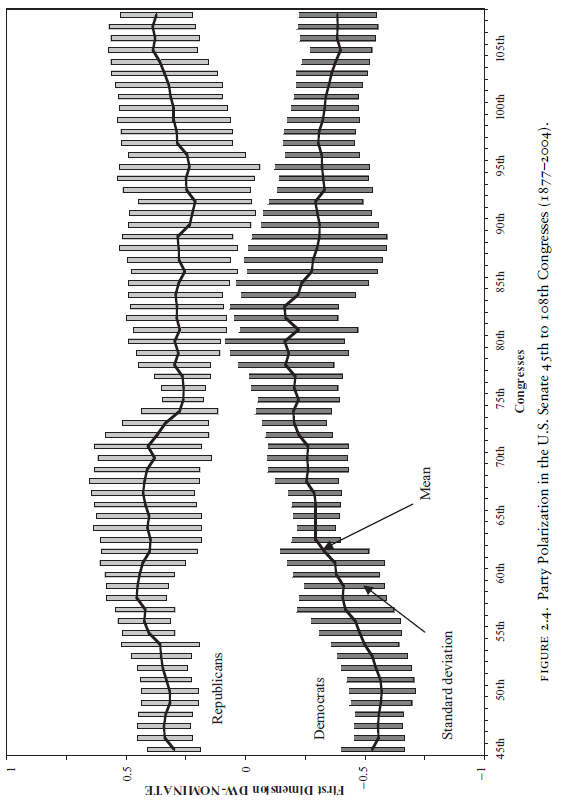
No and [then] yes, depending on the time frame. The first dimension of DW-NOMINATE, which measures the vote separation on the conservative-liberal axis has been increasing since the 1970s, after reaching a minimum in the 1950s.
Figures 2.3 and 2.4 show
both the degree of heterogeneity between the parties and the degree of
homogeneity within the parties in the House and Senate, respectively.
The light (likewise, dark) gray area represents the spread of the Republican
(Democratic) party one standard deviation above and below the
mean. The lines running through the gray areas are the means of the
respective parties’ DW-NOMINATE scores. The figure shows that
the overall trend from 1877 until at least the mid-1930s is one of party
convergence. This convergence, which continued through the Roaring
Twenties, the Great Depression, and World War II, reached its zenith
in both the House and Senate with President Dwight D. Eisenhower’s
election in 1952. [...]
[But the same figures] demonstrate that party polarization began in earnest in
the early 1970s. Within 10 years of Watergate, the parties’ mean DWNOMINATE
separated by 13 percent in the House and 19 percent in
the Senate. By the end of the 108th Congress, the separation between
the parties had increased to 44 percent in the House and 38 percent
in the Senate.


Quote and figures from the book Party Polarization in Congress by Sean M. Theriault (Cambridge University Press, 2008). The data in the book is only up to 2004, but I doubt the trend has changed since then. Wikipedia has a somewhat similar figure going up to 2007, but only in the House. One of the funny things mentioned in the book (with extensive quotes) is that in the 1960 a lot of commentator were complaining that there wasn't any observable difference between the two [main] US parties.
As for simpler measures (which alas I haven't found published over longer periods of time, since DW-NOMINATE became such a hit with US political scientists):
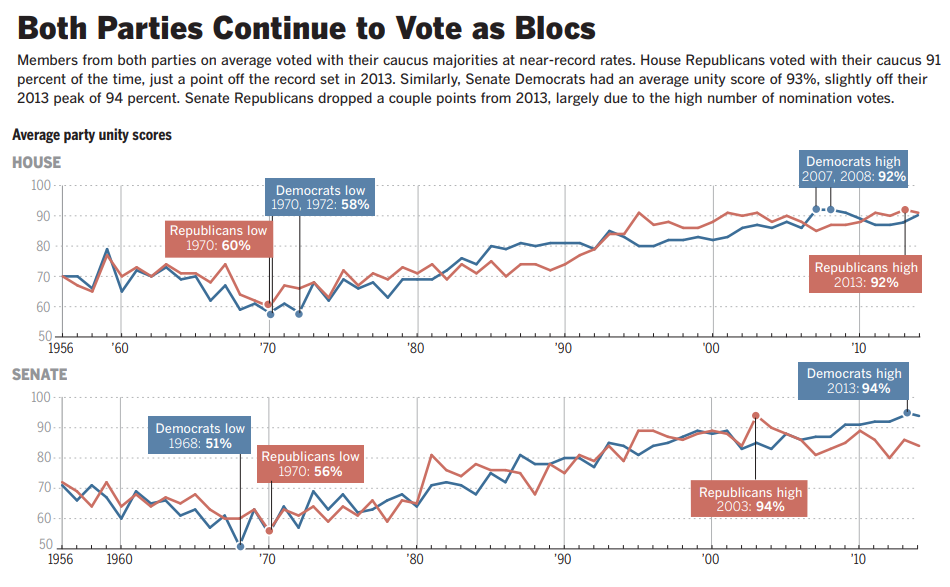
Since the 1970s, both the number of party unity votes in Congress and the average member’s party unity score have increased, with the average party unity score among members rising dramatically from around 60% in the early 1970s to around 90% in contemporary Congresses (Carney 2015). This pattern is consistent across both the House and Senate and both the Republican and Democratic parties.
The latter article also has a graph over time (since the 1950s):

As an addendum of sorts, if you wonder why political scientists prefer complicated methods like DW-NOMINATE (in measuring polarization), is that they shed additional light not easily observable in simple measures like "party unity". For example,
Hare & Poole, The Polarization of Contemporary American Politics (2013):
One of the underappreciated aspects of contemporary political polarization has been how
a diverse set of policy conflicts --- from abortion to gun control to immigration --- have
collapsed into the dominant economic liberal-conservative dimension of American
politics. That is, not only have the parties moved further apart on this ideological
dimension in recent decades, but the meaning of the dimension itself has changed as it
now encompasses a wider range of issues. The phenomenon has been termed “conflict extension” by Geoffrey Layman and Tom Carsey and its occurrence among party
activists and strong partisans in the electorate has been thoroughly documented by
Layman, Carsey and colleagues. [...]
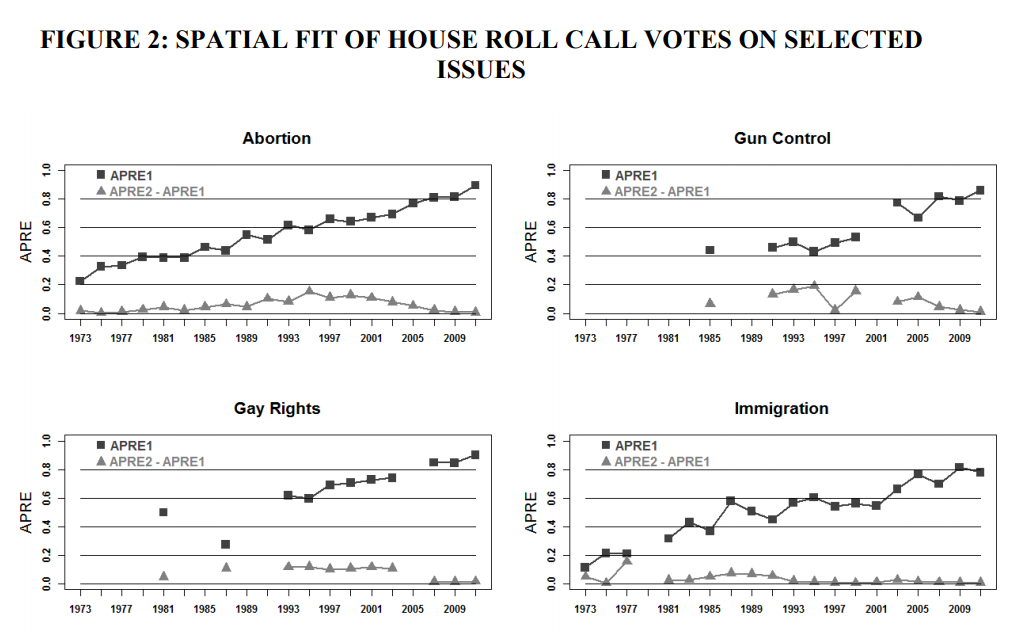
Below we measure the over-time fits of congressional roll call voting on four
social/cultural issues --- abortion, gay rights, gun control, and immigration --- in one and
two dimensions. The statistic we use to measure fit is the Aggregate Proportional
Reduction in Error (APRE). [...] APRE ranges between 0 and 1: a value of 0 indicates that the model provides no
improvement in classification beyond placing all votes in the modal (majority) category,
and an APRE value of 1 indicates the model perfectly classifies all choices (i.e., 0
classification errors). [...] The findings are presented in Figure 2. APRE1 is the APRE value from the one-dimensional model, while APRE2-APRE1 measures how much improvement in
classification the two-dimensional model provides over the one-dimensional model.
Across all four issues, we see a dramatic improvement in fit to the one-dimensional
model (i.e., along the liberal-conservative dimension) between the 1970s and the present. Interestingly, the addition of a second dimension never provides much of a boost
in model fit on these issues during this period. On abortion, gay rights, and gun control
votes, the second dimension improves classification most during the 1990s and early
2000s, but even in this period the APRE2 – APRE1 values never exceed 0.2. The
contribution of the second dimension to model fit for roll call voting on immigration
jumps during the mid-to-late 1980s, but the role of the second dimension has evaporated for all four of the issues in recent Congresses as these issues have been absorbed into the
expanding liberal-conservative divide between the parties.


