tl;dr- People who made less than $15,000/yr were 30% less likely to vote because a significant portion of that segment of the population was disaffected.
Disaffected people tend to lack an interest in both finance and politics, as shown by Pew Research studies cited below.
Update: Added a significant part to the start of this answer to clarify the question. The big point here is that less than 1-in-5 low-income Americans didn't vote compared to the average American. This answer explains that disaffect is the primary cause for these less-than-1-in-5 (~18.5%).
Clarifying the question, Part 1: Only 30% less likely to vote
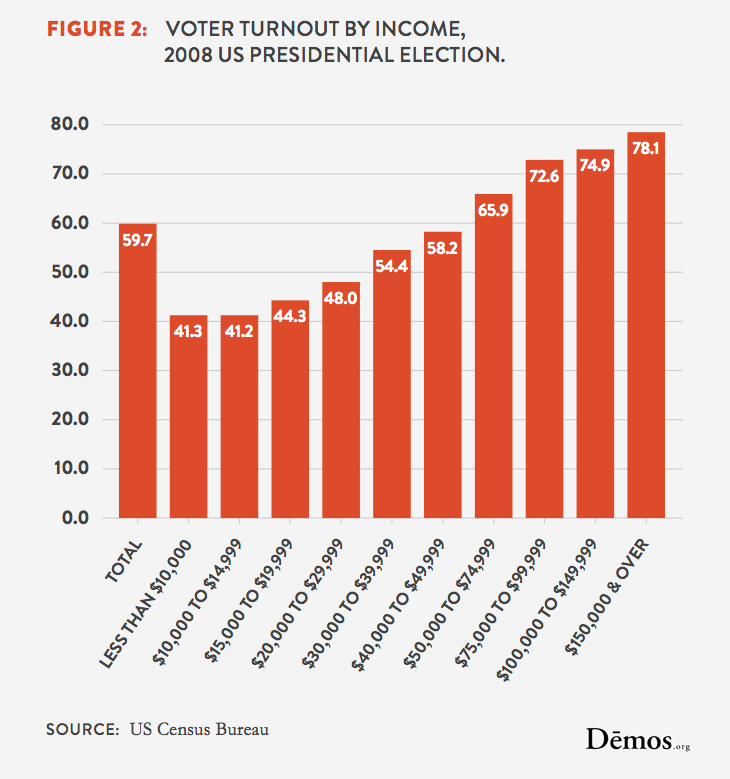
This question's source gets its information from a graph in this report:

Here, we can see that:
41.3% of Americans who made less than $10,000/yr voted.
41.2% of Americans who made $10,000/yr-to-$15,000/yr voted.
59.7% of Americans voted.
This means Americans who earned no/little money were about 30% less likely to vote than the average American (41.25%/59.7%=~69.1%).
Clarifying the question, Part 2: We're talking about 1/3 of the non-voting low-income Americans
If low-income Americans voted as much as the average American, then only about 59.7% of them would've voted, compared to the 41.25% that did.
So, whatever's causing their reduced voting rates, it's impacting only about 18.5% of low-income earners (59.7%-41.25%=~18.45%).
Clarifying the question, Part 3: Low-income Americans are a diverse group
Low-income Americans include pretty much everyone who's unemployed or works very few hours. However, it can also include college students, entrepreneurs working on a startup, and people in prison (I'd assume - haven't checked the data collection methodology).
So, we're talking about low-income earners rather than people who're necessarily "poor".
Bystanders, Disaffecteds, and Hard-Pressed Skeptics
Studies have shown that significant portions of the population are disaffected. They don't tend to make much money, and they're generally not too interested in politics. The central point of this answer is that they're a large enough group to explain much of the small disparity in voting rates between low-income earners and the average American.
Back in 2005, Pew Research published "Beyond Red vs. Blue", in which they attempted to use data mining techniques to group Americans into more robust subsets than conservatives (Red) vs. liberals (Blue). This study found two relevant groups: "Bystanders" and "Disaffecteds".
The study's since been repeated, most recently in 2014. The groups are recalculated each time; this time, the relevant groups are called "Bystanders" and "Hard-Pressed Skeptics". You can check out their characteristics under "Learn About Types" here.
As can be seen under "Demographics", Bystanders have the least income across all groups. They're pretty much defined by the fact that none of them (0%, according to Pew Research) are even sure that they're registered to vote. They just don't care about politics.
Hard-Pressed Skeptics are similar, though not as extreme. They make the second lowest income across all groups (after Bystanders) and have the second lowest voting turnout (again, after Bystanders). As the group's name suggests, they lead hard lives and have skeptical (cynical) outlooks.
Bystanders
Bystanders are on the sidelines of the political process, either by choice or because they are ineligible to vote. None are currently registered to vote. Most follow government and public affairs only now and then (32%) or hardly at all (32%).
- Bystanders express relatively low interest in business and finance and, not surprisingly, government and politics.
-Pew Research (2014)
Hard-Pressed Skeptics
Deeply financially-stressed and distrustful of government, Hard-Pressed Skeptics lean toward the Democratic Party but have reservations about both political parties. They want government to do more to solve problems, but have doubts about its efficiency. Hard-Pressed Skeptics are dissatisfied with conditions in the country and their communities. They are among the most cynical about the ability of individuals to improve their lot through hard work. These attitudes may reflect their distressed financial conditions: Hard-Pressed Skeptics have the lowest family incomes of any of the typology groups.
Just 39% of Hard-Pressed Skeptics say they are interested in government and politics, the lowest percentage of any typology group.
Only about a third of Hard-Pressed Skeptics (32%) say they work-full-time.
-Pew Research (2014)
Not work-scheduling problems
Referring to the above graph that the numbers in the question come from, people who made less than $10,000/yr had the same voting rate as people who made $10,000-$15,000/yr. Minimum wage laws mean that no one regularly working full-time or near-full-time can fall into this category.
So while it's true that work schedules can dissuade people from voting, that doesn't help answer this question since people who are unemployed and working very part-time vote the least. Further, this report (2015) shows that people who make more money work more on average. Taken together, this means that there's a positive correlation between hours worked and tenancy to vote.
In short, work schedules aren't why people in this income bracket vote less than others. In reality, it's likely that this demographic's reduced work load offsets their other reasons for not going to the polls.
Comments
This issue's fairly sad because it largely observes that a significant portion of the population's given up. This is a harder issue to fix than other proposals like limited access to the polls or work conflicts.
This answer focuses on disaffect as that seems to be the primary factor that explains most of the disparity in voting rates. However, there are other factors that contribute. For example, sampablokuper's answer correctly points out that voter suppression happens. While I'd argue that it's a minor effect, it's still part of the overall picture. Another factor might be access to personal transportation.
