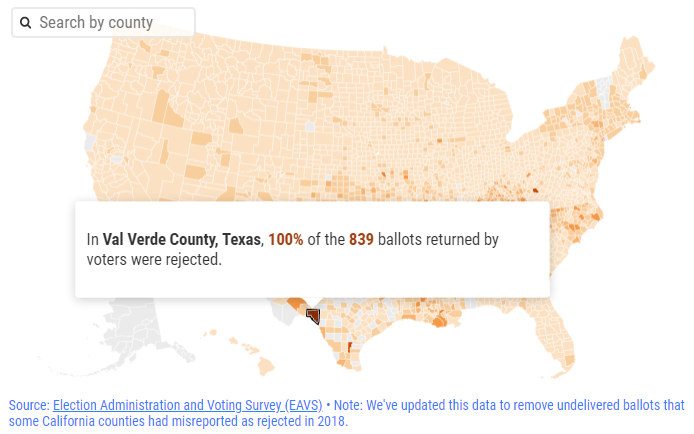
ABC has a fairly detailed analysis of mail-in ballot rejection rated in the 2016 and 2018 elections. A couple of Texas counties stand out on the map they show as having 100% rejection rate, namely Val Verde county and Hardeman county, albeit the latter with a small raw count of only 111 such votes (the former shown below with 839):
Is anything more known why these Texas counties had such a high rejection rate for mail-in ballots in 2016? It seems peculiar because in 2018 the raw number of mail-in ballots was almost the same in Val Verde county (842), but the rejection rate was only 3.2%. In Hardeman county the rejection rate dropped to 0% in 2018 with 58 mail-in ballots cast. (I'm sparing you the map screenshot[s] for 2018 here.) ABC notes that the national trend was actually in the opposite direction, with more mail-in ballots rejected in 2018 [425,000 out of 30 million] compared to 2016 [300,000 out of 33 million]. (There is a third county in Texas with 100% rejection rate in 2018, but there were only 4 mail-in votes involved, so that's not a terribly noteworthy event.)
