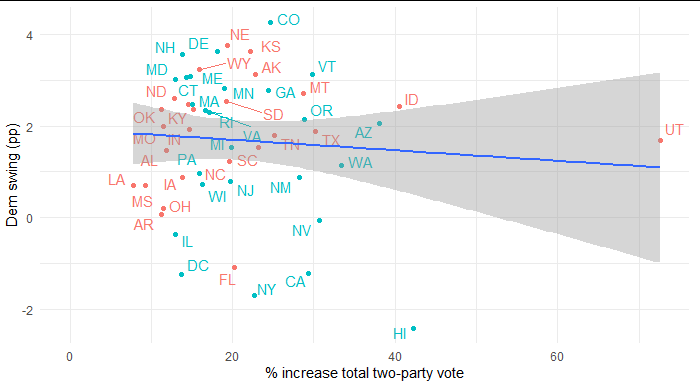
The data for this question, and many you ask, is readily available from the MIT Election Lab, specifically here I used the "U.S. President 1976-2020" dataset.
The correlation between the figures you ask is r=-.08, p=.6. If you remove Utah, which had a successful third party candidate in Evan McMullin in 2016 (receiving 21.5% of the vote), the correlation becomes r=-.11, p=.4. This means there is no statistically significant correlation between increase in turnout and swing toward the Democrats.

R Code:
library(tidyverse)
library(ggrepel)
library(Hmisc)

setwd("~/")

load("1976-2016-president.RData")

potus <- read_csv("1976-2020-president.csv") %>%
  filter(
    year %in% c(2016, 2020),
    party_simplified %in% c("DEMOCRAT", "REPUBLICAN")
  ) %>%
  select(year, state_po, party_simplified, candidatevotes) %>%
  group_by(year, state_po, party_simplified) %>%
  summarize(
    # A few places where some states have two DEM/REP lines
    candidate_votes = sum(candidatevotes),
  ) %>%
  ungroup() %>%
  group_by(year, state_po) %>%
  mutate(
    # Create new two-party vote total
    two_party_vote = sum(candidate_votes)
  )

potus_wide <- potus %>%
  pivot_wider(id_cols = c(year, state_po, two_party_vote),
              names_from = party_simplified,
              values_from = candidate_votes) %>%
  mutate(
    pct_dem = DEMOCRAT / two_party_vote,
    pct_gop = REPUBLICAN / two_party_vote
  )

years_wide <- potus_wide %>%
  pivot_wider(id_cols = state_po,
              values_from = c(two_party_vote, DEMOCRAT, REPUBLICAN,
                              starts_with("pct_")),
              names_from = year) %>%
  mutate(
    pct_inc_totalvotes = (two_party_vote_2020 / two_party_vote_2016) * 100 - 100,
    pct_dem_swing = (pct_dem_2020 - pct_dem_2016) * 100,
    dem_win = DEMOCRAT_2020 > REPUBLICAN_2020
  ) %>%
  ungroup()

years_wide %>%
  select(pct_inc_totalvotes, pct_dem_swing) %>%
  as.matrix() %>%
  rcorr()

ggplot(years_wide, aes(x = pct_inc_totalvotes, y = pct_dem_swing)) +
  geom_point(aes(color = dem_win)) +
  geom_text_repel(aes(label = state_po, color = dem_win)) +
  geom_smooth(method = "lm") +
  scale_x_continuous(limits = c(0, NA)) +
  theme_minimal() +
  theme(legend.position = "none") +
  labs(x = "% increase total two-party vote", y = "Dem swing (pp)")

years_wide %>%
  filter(state_po != "UT") %>%
  select(pct_inc_totalvotes, pct_dem_swing) %>%
  as.matrix() %>%
  rcorr()
