Using the Cooperative Congressional Election Study 2018, we can test your hypothesis that non-African Americans skew as far to the Republicans as African Americans do to Democrats. Let's limit ourselves firstly to voters in the deep south, which I'll define as Louisiana, Mississippi, Alabama, Georgia, & South Carolina. This gives us a survey population of 4,920.
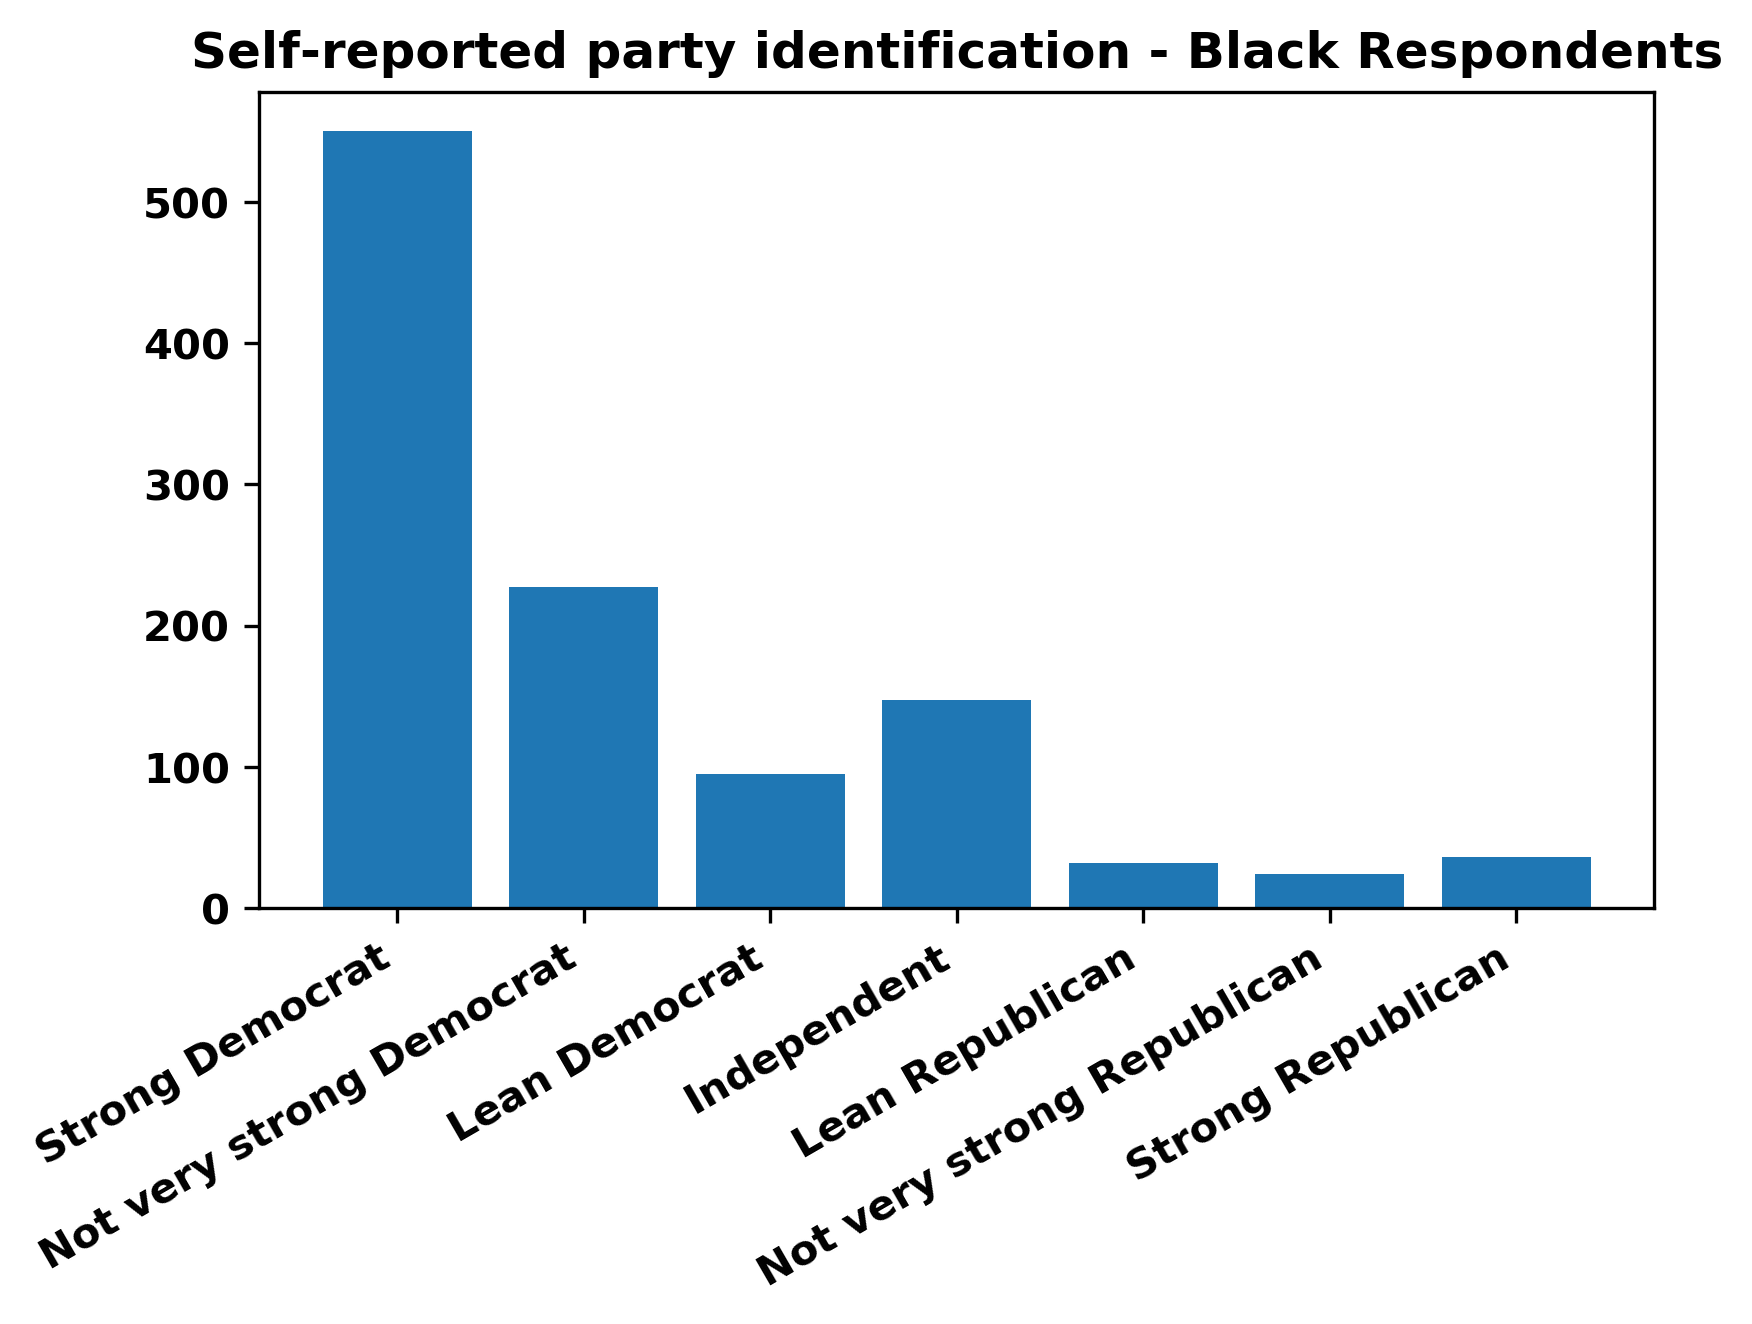
We can then stratify the survey population by race, and look at how they identify politically. Looking at the 1,155 of these respondents who self-identified as 'Black', we can construct the following breakdown - clearly black respondents skew heavily towards the Democratic Party.

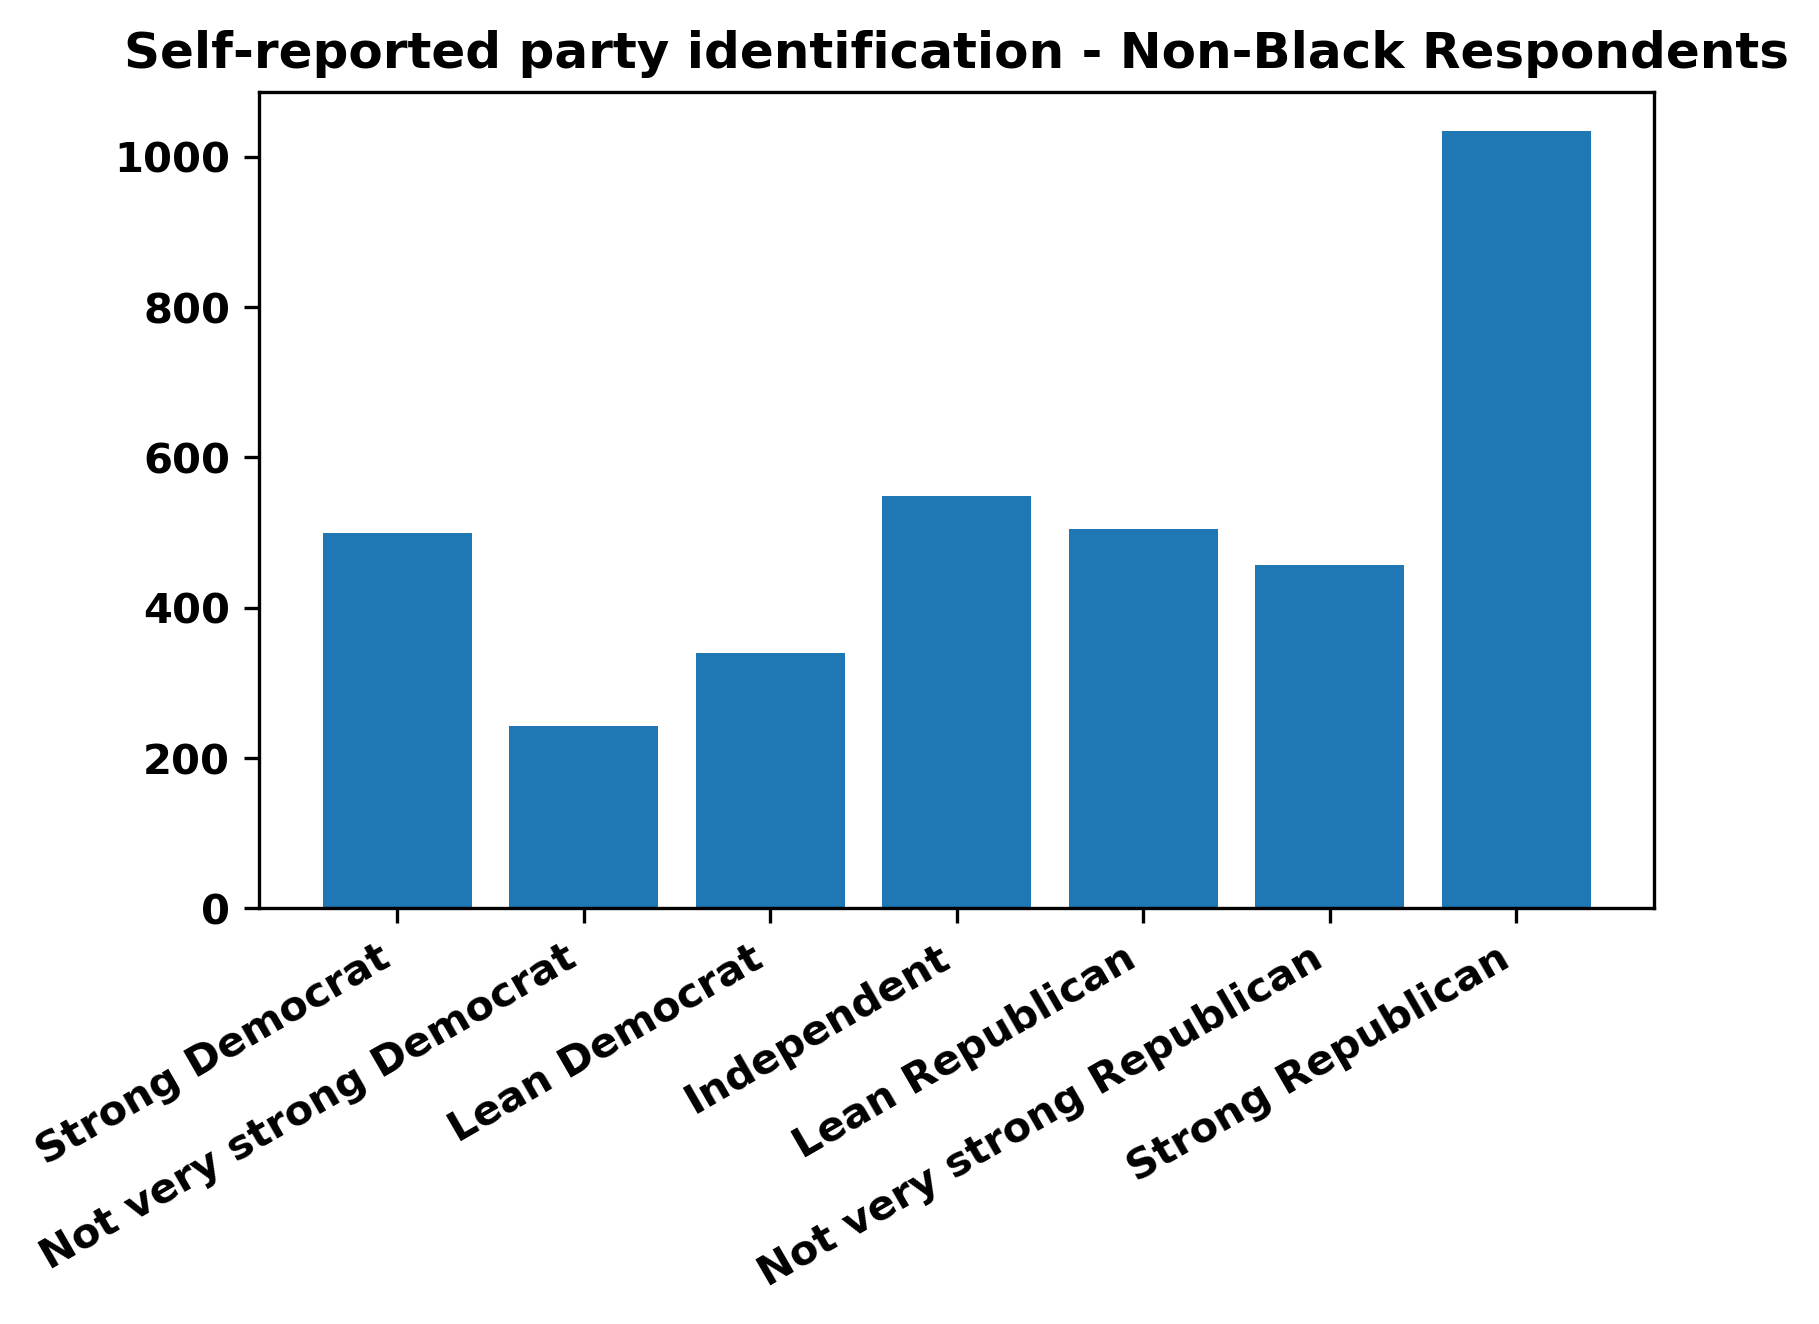
Looking now at the remaining respondents, we can obtain a very different graph - we see a large number of 'Strong Republican' respondents, as well as a general skew towards the Republican end of the scale. However, there isn't quite such a well-defined skew as the first graph.

Despite the skew not being quite so dramatic, it is dramatic enough to ensure that the states as a whole generally vote Republican. Firstly, the 40% figure in your question isn't quite accurate - according to the American Community Survey 2018 figures, Black or African American Alone makes up between 26.6% (South Carolina), and 38.0% (Mississippi) of the population, for a total proportion of around 30.6% of the population of the above five states. This factor, exacerbated by a small turnout gap, allows the vast Democratic lean amongst the Black population to be outweighed by the relatively smaller, but still large, Republican lean within the non-Black population.

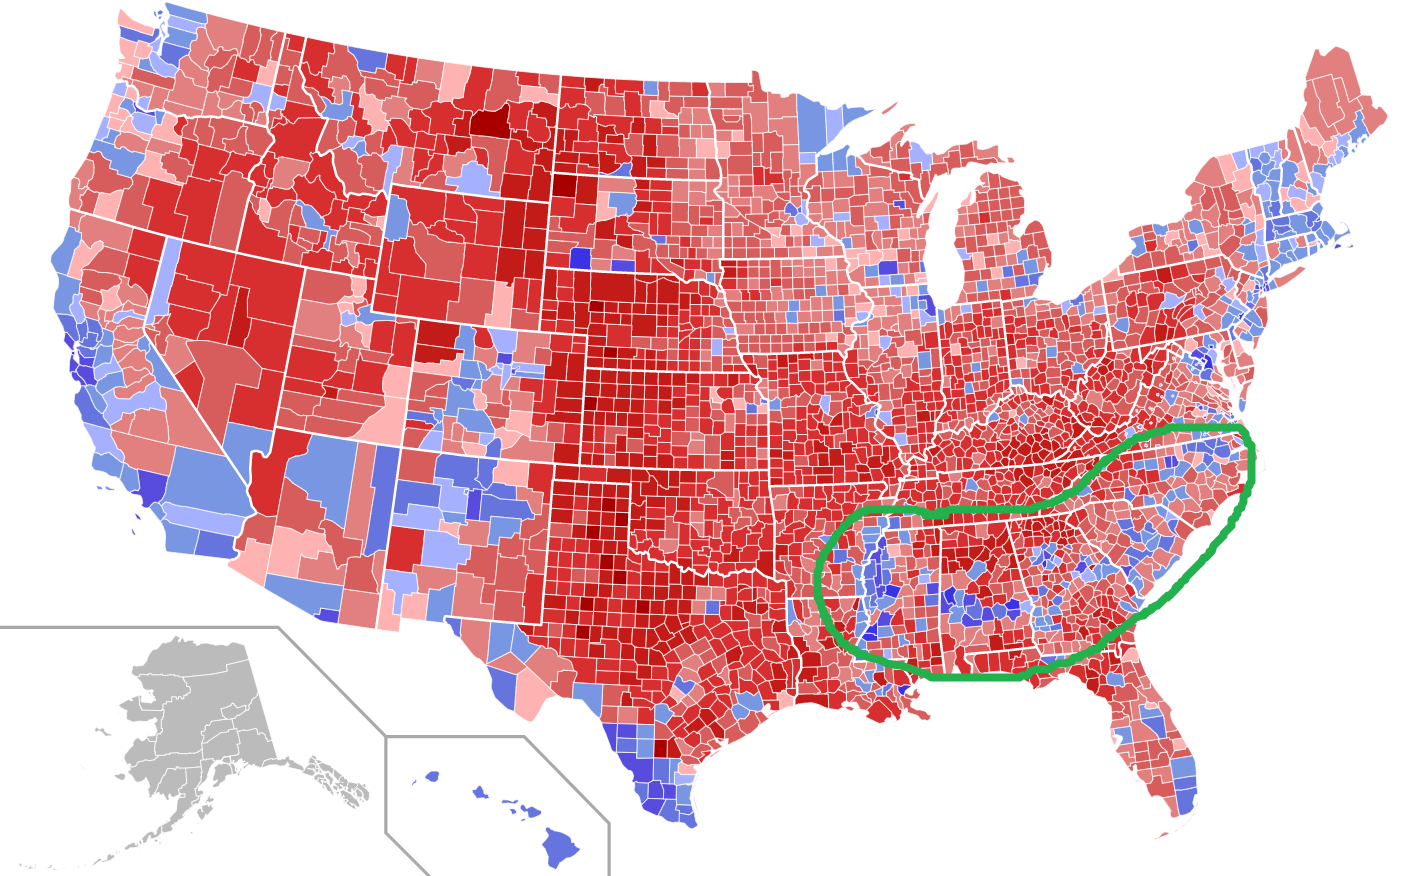
However, on a more local level, the African American demographic does have a significant effect. As the population tends to be centred around the 'Black Belt', this allows the Democratic lean of the demographic to be more obviously represented. For example, the county-level map of the 2016 election provides an interesting depiction of this phenomenon.


